
EXAMPLE 1
Science. The numbers of named stars in a group of 34 constellations are listed below. Make a frequency table of the data. 7, 5, 4, 10, 5, 7, 2, 6, 8, 1, 5, 1, 3, 1, 12, 11, 2, 11, 2, 5, 0, 6, 14, 8, 3, 1, 15, 10, 0, 2, 0, 15, 9, 1. STEP 1.

EXAMPLE 1
E N D
Presentation Transcript
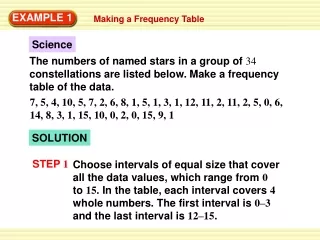
Science The numbers of named stars in a group of 34 constellations are listed below. Make a frequency table of the data. 7, 5, 4, 10, 5, 7, 2, 6, 8, 1, 5, 1, 3, 1, 12, 11, 2, 11, 2, 5, 0, 6, 14, 8, 3, 1, 15, 10, 0, 2, 0, 15, 9, 1 STEP 1 Choose intervals of equal size that cover all the data values, which range from 0 to 15. In the table, each interval covers 4 whole numbers. The first interval is 0–3 and the last interval is 12–15. EXAMPLE 1 Making a Frequency Table SOLUTION
Make a tally mark next to the interval containing a given number of named stars. STEP 2 STEP 3 Write the frequency for each interval by totaling the number of tally marks for the interval. EXAMPLE 1 Making a Frequency Table
Music Every Sunday morning, a radio station plays a countdown of the top 30 requested songs from the previous week. The table shows the number of weeks that each of the songs on this week’s top 30 have been on the countdown. EXAMPLE 2 Making a Histogram Make a histogram of the data.
STEP 1 Draw and label the horizontal and vertical axes.List each interval from the frequency table on the horizontal axis. The greatest frequency is 11. So, start the vertical axis at 0 and end at 12, using increments of 2. EXAMPLE 2 Making a Histogram SOLUTION
Draw a bar for each interval. The bars should have the same width. STEP 2 Bars that are next to each other should not have a gap between them. Include horizontal gridlines. EXAMPLE 2 Making a Histogram
Typing Rates 25, 19, 23, 29, 34, 26, 30, 40, 33, 20, 35, 35, 25, 29, 36, 22, 31 GUIDED PRACTICE for Examples 1 and 2 The numbers of words that students in a typing class can type in a minute are listed. Make a frequency table and histogram of the data.
ANSWER GUIDED PRACTICE for Examples 1 and 2
School Lunches The number of students in your class who brought their lunch to school each day for the past two week is given below. Make a frequency table and histogram of the data. 21, 12, 15, 21, 11, 8, 16, 18, 23, 27, 12, 14, 12, 12 GUIDED PRACTICE for Examples 1 and 2
ANSWER GUIDED PRACTICE for Examples 1 and 2


