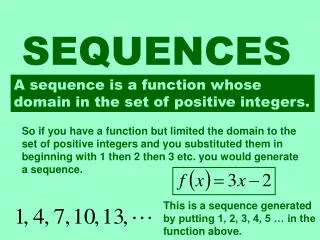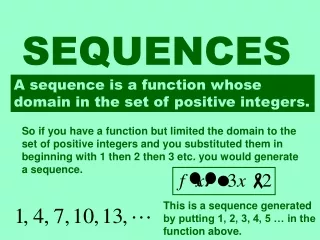
Sequences
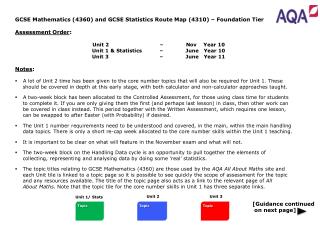
AQA GCSE Mathematics (4360) and GCSE Statistics (4310) Route Map – Foundation Tier [Year 9]. Year 9. Holiday. November Examinations. Holiday. Holiday. Holiday. March Examinations. Holiday. Holiday. Holiday. Sequences. Coordinates and Graphs. Basic Algebra. Number. June

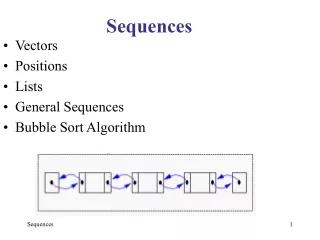
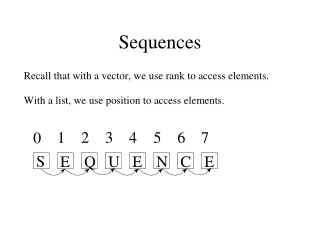
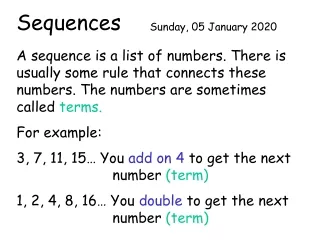
Sequences
E N D
Presentation Transcript
AQA GCSE Mathematics (4360) and GCSE Statistics (4310) Route Map – Foundation Tier [Year 9] Year 9 Holiday November Examinations Holiday Holiday Holiday March Examinations Holiday Holiday Holiday Sequences Coordinates and Graphs Basic Algebra Number June Examinations June Examinations Indices Percentages Fractions Decimals Year 10
AQA GCSE Mathematics (4360) and GCSE Statistics (4310) Route Map – Foundation Tier [Year 10] Year 10 Holiday Recap: Number, Fractions, Decimals and Percentages November Examinations REVISION Ratio and Proportion Equations & Inequalities Formulae and Algebraic Argument REVISION SIT UNIT 2 Holiday Holiday Introduction to Data Handling Cycle & Types of Data Statistical Measures (Spread and Skew) Scatter Graphs Time Series Data Collection Methods Sampling Methods Statistical Measures (Averages) Holiday • Recap (Number work). Include the following (emphasis on calculator methods) • Fractions 2) Decimals • 3) Percentages 4) Ratio and • Proportion Other methods of Data Representation Data Handling Cycle/ CONTROLLED ASSESSMENT WRITTEN ASSESSMENT/ Indices and Rates March Examinations Holiday Holiday Holiday Probability REVISION REVISION Miscellaneous Work June Examinations June Examinations Angles SIT UNIT 1 / REVISION FOR STATS SIT STATISTICS EXAM Year 9 Year 11
AQA GCSE Mathematics (4360) and GCSE Statistics (4310) Route Map – Foundation Tier [Year 11] Year 11 Holiday Algebraic Manipulation Drawing and Constructing Shapes; Loci Properties of Polygons & Circles Number, Fractions & Decimals Perimeter, Area and Volume Algebraic Manipulation Percentages & Ratio November Examinations Holiday Holiday REVISION Recap (seasonal) Trial & Improvement Reflections, Rotations, Translations & Enlargements Measures Bearings 2D Representations of 3D Shapes Holiday Coordinates & Applications of Linear Graphs Quadratic Graphs Pythagoras’ Theorem REVISION REVISION March Examinations Holiday Holiday Holiday REVISION REVISION June Examinations June Examinations Year 10
View next page Unit 2 – Number (Slide 1 of 2)
View next page Unit 2 – Coordinates & Graphs (Slide 1 of 2)
View next page Unit 2 – Fractions (Slide 1 of 2)
View next page Unit 2 – Decimals (Slide 1 of 2)
Unit 1 – Introduction to Data Handling Cycle & Types of Data (Slide 1 of 2) NB: Both issues are key to success in Statistics. Fuller consideration of the Data Handling Cycle can be given prior to the Controlled Assessment. This section covers pages 7 and 8 in the Statistics specification up to Obtaining Data.
Unit 1 – Introduction to Data Handling Cycle & Types of Data (Slide 2 of 2)
Unit 1 – Data Collection Methods (Slide 1 of 3) NB: This section covers pages 8 to 11in the Statistics specification, from Obtaining Data up to Diagrammatic Representation but excluding Sampling.
View previous page Unit 1 – Data Collection Methods (Slide 2 of 3)
View previous page Unit 1 – Data Collection Methods (Slide 3 of 3) (Slide 3 of 3)
Unit 1 – Sampling Methods NB: This covers the Sampling section on page 9 in the Statistics specification.
Unit 1 – Statistical Measures: Averages NB: It is perfectly possible to combine the separated sections on Statistical measures and deliver all at once if desired. This section covers Measures of Location on page 13 in the Statistics specification.
Unit 1 – Statistical Measures: Spread and Skew NB: This section covers Measure of Spread on page 13/14 in the Statistics specification (box and whisker plots and outliers can be covered as well here).
Unit 1 – Scatter Graphs NB: This section covers Correlation and Regression on pages 15/16 in the Statistics specification and includes awareness of Spearman’s values (not calculating them).
Unit 1 – Time Series NB: This section covers Time Series on pages 14/15 in the Statistics specification.
Unit 1 – Other Methods of Data Representation (Slide 1 of 2) NB: A three week period (but see above) to cover most of the other diagrammatical methods required, excluding those which are stand-alone and are covered in Miscellaneous Work. This section covers Diagrammatic Representation on pages 11/12 in the Statistics specification.
View previous page Unit 1 – Other Methods of Data Representation (Slide 2 of 2)
View previous page Unit 1 – Fractions (Slide 2 of 2)
View previous page Unit 1 – Decimals (Slide 2 of 2)
Unit 1 – Indices and Rates NB: This 45 written test based on the students’ Controlled Assessments requires one lesson so the other two can be used for teaching Indices and Rates. This section covers Other Summary Statistics on page 14 in the Statistics specification and should also include a brief mention of GDP and output gap charts.
Unit 1 – Probability This section covers the section on Probability on pages 16/17 in the Statistics specification.
Unit 1 – Miscellaneous Work (Suggested topics to cover) NB: Some small parts of the Statistics specification that don’t really fit anywhere else can be covered here, or you may feel there is a different time that some of these might be covered. There is also spare time left should these take more than one week. The suggested topics for here are choropleth maps (page 11); misuse of scales, area or volume in diagrams (page 12), estimation (page 16) and simulation (page 10).
View previous page Unit 3 – Angles (Slide 2 of 3)
View previous page Unit 3 – Angles (Slide 3 of 3)
Unit 3 – Drawing & Constructing Shapes; Loci (Slide 1 of 2)
View previous page Unit 3 – Drawing & Constructing Shapes; Loci (Slide 2 of 2)
View previous page Unit 3 – Number, Fractions and Decimals (2 of 3)
View previous page Unit 3 – Number, Fractions and Decimals (3 of 3)