Download
1 / 37
370 likes | 498 Views
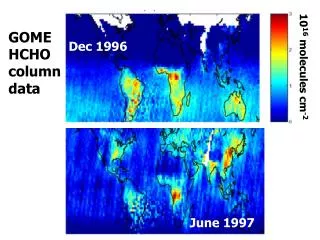
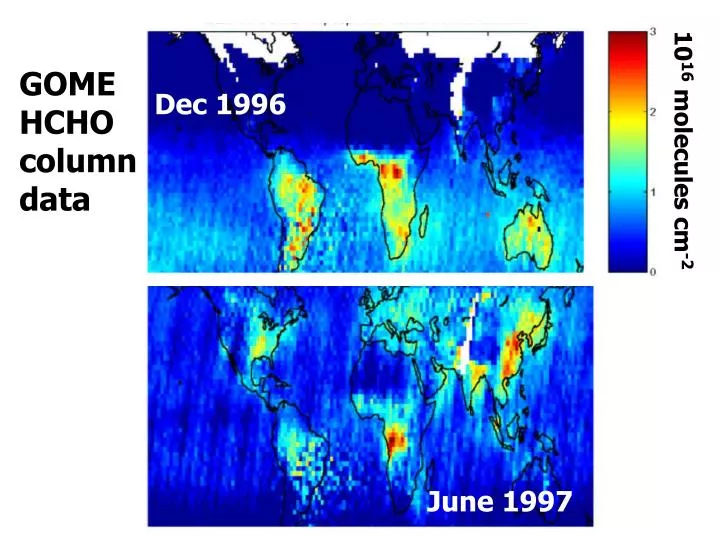
GOME HCHO columndata. Dec 1996. 10 16 molecules cm -2. June 1997. North American Hydrocarbon Emissions Measured from Space. Paul Palmer , Daniel Jacob, Arlene Fiore, Randall Martin, Dorian Abbot, Kelly Chance, Thomas Kurosu Division of Engineering and Applied Sciences

E N D
GOME HCHO columndata Dec 1996 1016 molecules cm-2 June 1997
North American Hydrocarbon Emissions Measured from Space Paul Palmer,Daniel Jacob, Arlene Fiore, Randall Martin, Dorian Abbot, Kelly Chance, Thomas Kurosu Division of Engineering and Applied Sciences Harvard University http://www.people.fas.harvard.edu/~ppalmer
Overview • Why are accurate hydrocarbon emissions important? • Relating measured HCHO columns to specific hydrocarbon emissions • Are satellite observations consistent with in situ data? • The future?
O2 hv O3 STRATOSPHERE TROPOSPHERE hv OH HNO3 NO2 NO O3 OH HO2 H2O2 hv, H2O CO, hydrocarbons, NOx HCHO + h 2HO2 + CO (radical channel) HCHO + OH HO2 + CO + H2O lifetime = few hrs
Summertime in situ HCHO datasets Fried et al 1997 Harris et al 1989 Kleindienst et al 1988 Lee et al 1995, 1998 Martin et al 1991 McKeen et al 1997 OZIE -Guenther Reimer et al 1998 Shepson et al 1991 ppb
Aircraft HCHO profile data North Atlantic Regional Experiment 1997 Southern Oxidant Study 1995 measurements GEOS-CHEM model Altitude [km] Altitude [km] Defined background CH4 + OH [ppb] Continental outflow Surface source (mostly isoprene+OH)
Global Ozone Monitoring Experiment • Nadir-viewing SBUV instrument • Launched April 1995 • Pixel 320 x 40 km2 • 10.30 am cross-equator time • Global coverage in 3 days • O3, NO2, BrO, OClO, SO2, HCHO, H2O, & cloud coverage
HCHO slant column fitting Chance et al [2000] • O3 • NO2 • BrO • O2-O2 3 x 10¹⁶ molec cm-2 8 x 10¹⁶ molec cm-2 1fitting uncertainty4 x 1015 molec cm-2
vertical column = slant column /AMF GEOS-CHEM satellite lnIB/ Sigma coordinate () dHCHO 1 Earth Surface HCHO mixing ratio C() Scattering weights Shape factor S() = C() air/HCHO w() = - 1/AMFGlnIB/ 1 AMF = AMFG w() S() d 0
AMF example - Tennessee S() w() AMF 0.71 AMFG 2.08 w() GEOS-CHEM S() AMF calculation every GOME July 1996 scene...
GEOS-CHEM global 3D model: 101 • Driven by DAO GEOS met data • 2x2.5o resolution/26 vertical levels • O3-NOx-VOC chemistry • GEIA isoprene emissions • Aerosol scattering: AOD:O3 Dickerson et al, [1997]
HCHO columns – July 1996 GEOS-CHEM r2 = 0.7 n = 756 Bias = 11% [1016molec cm-2] GOME HCHO fitted in UV (~340 nm) 1 uncertainty:4 x 10¹⁵ molec cm-2
GOME Isoprene “volcano” GEOS-CHEM July 7 1996 July 20 1996 [1016 molec cm-2] mm
How do we validate satellite observations? GOME, MOPITT, SCIAMACHY TES, OMI Global 3d model of chemistry
Relating HCHO columns to hydrocarbon emissions Chemical loss kHCHO • Absence of transport = YiEi HCHO HC oxidation ki (HCHO yield Yi) i Emission Ei kHCHO HCi
HCHO yields from HCs Total: 86%
Horizontal transport displaces HCHO signal Displacement length scale L d,i=U ki () ln ki -kHCHO kHCHO midmorning eg values KHCHO = 0.5h-1; U = 20kmh-1; [OH]=5E6 mol cm-3 ISOP Ld,i 40 km CH4Ld,i = many 1000s km CH3OH Ld,i =100s km
GEOS-CHEM HCHO columnsJuly 1996 GEIA isoprene emissions [1016 molec cm-2]
July 1996 (25-50oN, 65-130oW) NW NE Slope S = Y/kHCHO Model HCHO column [1016 molec cm-2] SW SE model without isoprene Isoprene emission [1013 atomC cm-2 s-1]
GOME Isoprene “volcano” GEOS-CHEM July 7 1996 July 20 1996 [1016 molec cm-2] mm
The Ozarks • Dissected plateau - 129,500 sq km • Oak forests – good isoprene emitters Cambridge, MA "Trees cause more pollution than automobiles do."
Ozark Isoprene Experiment 1998 Result Summary Type Spec ppb Alt [m] Local time Balloon Isop 1-7 400-1000 0830-1930 Plane Isop 3-6 450-900 1800-2000 Surface HCHO 7-15(11) 0830-1930 Plane HCHO 3-11(7) 1300-1800 Photos c/o Alex Guenther, NCAR
HCHO data over the Ozarks SOS 1999 Aircraft data @ 350 m during July 1999 Illinois Missouri Kansas OZARKS [ppb] c/o Y-N. Lee, Brookhaven National Lab.
GOME Isoprene “volcano” GEOS-CHEM Temperature dependence of isoprene emission July 7 1996 Slant column HCHO [1016 mol cm-2] Surface temperature [K] July 20 1996 [1016 molec cm-2]
GEIA EPA BEIS2
Summertime in situ HCHO datasets Fried et al 1997 Harris et al 1989 Kleindienst et al 1988 Lee et al 1995, 1998 Martin et al 1991 McKeen et al 1997 OZIE -Guenther Reimer et al 1998 Shepson et al 1991 ppb
Modeling in situ data GEIA BEIS2 r2 = 0.65 Bias -30% r2 = 0.53 Bias -3%
Model Transfer functions NW NE Model HCHO column [1016 molec cm-2] SW SE model without isoprene Isoprene emission [1013 atomC cm-2 s-1]
GOME isoprene emissions – July 1996 [1012 atom C cm-2 s-1]
Consistency: GOME and in situ data r2 = 0.77 Bias -12%
Global HCHO from GOME: July 1996 [1016 molec cm-2]
Global HCHO from GOME: Oct 1996 [1016 molec cm-2]
CONSTRAINING SEASONAL AND INTERANNUAL VARIABILITY IN BIOGENIC VOC EMISSIONS HCHO columns, Jun-Aug 1997 GOME GEOS-CHEM
Summary • New methodology for HC emission from space-based HCHO columns • Isoprene is dominant HC for North American summertime • GOME shows Ozarks isoprene volcano • GOME data consistent with in situ data • Future work will include global mapping