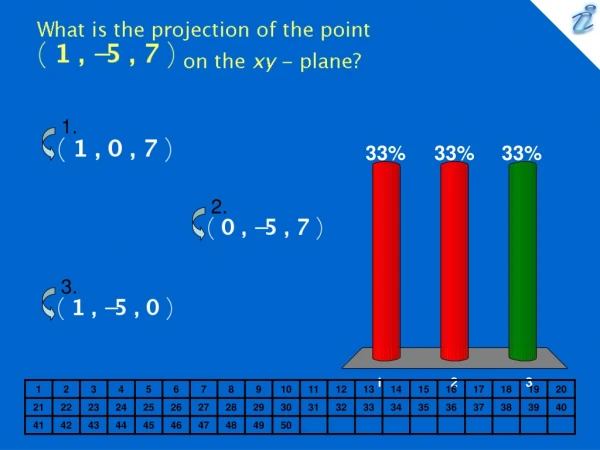
Download
1 / 29
290 likes | 424 Views
6.4 Areas in the xy-Plane. This section shows how to use the definite integral to compute the area of a region that lies between the graphs of two or more functions. Integral properties we will be using. Consider a region bounded both above and below by graphs of functions.

E N D
This section shows how to use the definite integral to compute the area of a region that lies between the graphs of two or more functions.
Consider a region bounded both above and below by graphs of functions.
We want to find a simple expression for the area bounded above by y = f(x) and below by y = g(x) from x = a to x = b. Note that this is the region under f(x) with the region under g(x) taken away.
[area of bounded region] = [area under f(x)] – [area under g(x)]
Area Between Two Curves If y = f(x) lies above y = g(x) from x = a to x = b, then the area of the region between f(x) and g(x) from x = a to x = b is
Find the area of the region between y = 2x2 – 4x + 6 and y = -x2 + 2x + 1 from x = 1 to x = 2.
If we sketch the two graphs, we can discover the region of interest. We note that 2x2 – 4x + 6 lies above –x2 + 2x + 1 from x = 1 to x = 2.
Our formula for the area is then The solution to such problems is not always quite so straightforward.
Find the area of the region between y = x2 and y = x2 – 4x + 4 from x = 0 to x = 3.
We first sketch the graphs to discover the region of interest. Notice that the two graphs cross.
By setting x2 = x2 – 4x + 4, we find that the graphs cross at x = 1. We observe that y = x2 – 4x + 4 is on top from x = 0 to x = 1, and y = x2 is on top from x = 1 to x = 3. We cannot directly apply our rule to calculate the area. How do we find our answer?
When we have a situation where graphs cross, we determine the area of a desired region by breaking the region into separate parts. For our situation, we will divide our problem into two parts. We will find the area from x = 0 to x = 1, and then find the area from x = 1 to x = 3.
So, the total area we want is the sum of the two areas: 2 + 8 ----- 10
So far, the cases we have examined used nonnegative functions. What happens when we consider functions that are nonnegative?
Suppose we have two graphs of functions f(x) and g(x) that are not always positive. We want to find the area between f(x) and g(x) from x = a to x = b.
Select a constant c so that the graphs of f(x) + c and g(x) + c lie completely above the x –axis from x = a to x = b. Note that the region between f(x) + c and g(x) + c has the same area as the original region.
If we use our rule as applied to nonnegative functions, we have We see that our rule is valid for any functions f(x) and g(x) as long as the graph of f(x) lies above g(x) from x = a to x = b.
Set up the integral that gives the area between the curves y = x2 – 2x and y = -ex from x = -1 to x = 2.
Sketching the graphs, we discover that y = x2 – 2x lies above –ex for the entire interval.
Our rule for determining the area between two curves can be applied directly. The area is given by
Set up the integral that gives the area bounded by the two curves y = 2x2 and y = x3 – 3x.
We find the points where the two graphs cross by setting x3 – 3x = 2x2 and solving for x. We get the equation x3 – 2x2 – 3x = 0 If we factor the left side, we get x(x – 3)(x + 1) = 0 So, the solutions are x = -1, x = 0, and x = 3. These are the points at which the graphs cross. We note that the from x = -1 to x = 0, y = x3 – 3x lies above y = 2x2
The area from x = -1 to x = 0 is given by Recall that from x = 0 to x = 3, y = 2x2 lies above y = x3 – 3x. The area from x = 0 to x = 3 is given by