Download
1 / 20
200 likes | 296 Views
Health Coverage Issues of Children in Houston. Christopher M. Born Texas Children’s Health Plan February 1, 2007. Presentation to: CHIP Coalition – Legislative Staff Briefing. Robert Haas, Chairman and CEO Levi Strauss & Co.

E N D
Health Coverage Issues of Children in Houston Christopher M. Born Texas Children’s Health Plan February 1, 2007 Presentation to: CHIP Coalition – Legislative Staff Briefing
Robert Haas, Chairman and CEO Levi Strauss & Co “it used to be that what happened to your employees when they went home at the end of the day was their business. But today’s worker’s sick child is YOUR business, because if she’s worrying about her child or calling in sick when she isn’t – and probably feeling resentful because she had to lie – she isn’t going to be productive…..
The Impact of Uninsured Children • They consume healthcare anyway • Physicians • ER’s and hospitals • Clinics • They pay cash…but not much • A significant part of bad debt • Cost shifting to commercial insurers • At what price? – the issue of transparency • Early treatment is efficacious • An ounce of prevention…
Agenda • Research on children’s health coverage • Research on effects of continuous eligibility
Children’s Health Coverage Research • Timing and number of interviews • 2003-700 interviews • 2006-700 interviews • Representative of the 12 county area • Random digit dialing • Decision maker with one or more children who are less than 19 years of age
Rate of Insured Children 2003 2006 % Work Medicaid CHIP Private Purchase Households with Children Covered If Covered, Source of Coverage
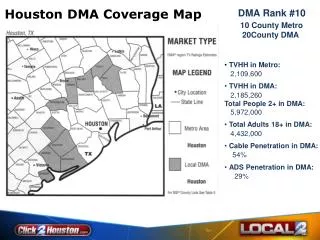
Comparison to CDC - % Uninsured • Improving in the Houston area and the US • Our belief is the Houston area results are better than Texas as a whole • But, almost 170,000 children are uninsured (could fill 3 Astrodomes)
Uninsured Children by Race • As confirmed by other studies, the Hispanic/Latino population has the highest uninsured children rates 2003 (P=.002) 18.0% 2006 (P=.004) 16.2% % 11.4% 9.0% 9.0% 8.2% 7.7% 6.7% Hispanic / Latino Black / African American Other White
Why are Children Uninsured? • Of those parents who work: • 29% do not have the option to purchase coverage at work • Looking specifically at the uninsured: • 64.5% do not have the option to purchase coverage at work • 31.6% do not qualify for CHIP or Medicaid • Regardless, it is a money issue: • $70/month: What they say they can afford • $291/month: Average estimate of premium for those who are insured
Unfortunate consequences of being uninsured • Do you take your children to a family doctor or pediatrician on a regular basis? • 2003: Overall, 82.0% said Yes (86.2% with insurance, 50.0% with no insurance, P=.000) • 2006: Overall, 83.1% said Yes (87.2% with insurance, 50.0% with no insurance, P=.000) • Have you taken any of your children to a specialist during the last 12 months? • 2003: Overall, 42.3% said Yes (44.7% with insurance, 24.4% with no insurance, P=.000) • 2006: Overall, 43.0% said Yes (46.0% with insurance, 18.4% with no insurance, P=.000) • When your (uninsured) child gets sick and needs medical attention, where do you take them? • 2003: Overall, 32.9% said to an ER/hospital • 2006: Overall, 27.6% said to an ER/hospital
Other Salient Points • Parents know about CHIP and Medicaid coverage 20032006 Chip: 61.0% 71.1% Medicaid: 67.1% 77.6% • Costs are increasing • Premiums, co-pays, and deductibles • Employee policy churn • Almost 40% of households state their children have been under 3 or more policies since birth
Agenda • Research on children’s health coverage • Research on effects of continuous eligibility
CHIP Eligibility and Cost Study • Timeframe – June 2000 through June 2004 • Average member cost per member per month • Consumption of health care in month one through month 24 • Aggregated costs of all members by month of eligibility
Correlation of Enrollment Duration and Length of Eligibility
Results “The decline in costs suggests that sustained enrollment and continuous access to health care providers results in a reduction in average cost over time”