Download
1 / 30
300 likes | 398 Views
Scalability Study of S3D using TAU. Sameer Shende tau-team@cs.uoregon.edu. Acknowledgements. Alan Morris [UO] Kevin Huck [UO] Allen D. Malony [UO] Kenneth Roche [ORNL] Bronis R. de Supinski [LLNL] The performance data presented here is available at:

E N D
Scalability Study of S3D using TAU Sameer Shende tau-team@cs.uoregon.edu
Acknowledgements • Alan Morris [UO] • Kevin Huck [UO] • Allen D. Malony [UO] • Kenneth Roche [ORNL] • Bronis R. de Supinski [LLNL] The performance data presented here is available at: http://www.cs.uoregon.edu/research/tau/s3d
TAU Parallel Performance System • http://www.cs.uoregon.edu/research/tau/ • Multi-level performance instrumentation • Multi-language automatic source instrumentation • Flexible and configurable performance measurement • Widely-ported parallel performance profiling system • Computer system architectures and operating systems • Different programming languages and compilers • Support for multiple parallel programming paradigms • Multi-threading, message passing, mixed-mode, hybrid
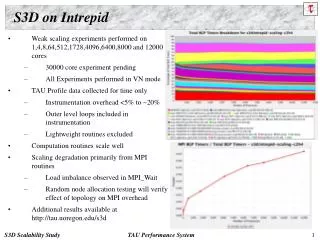
Scalability Study • Harness testcase • Platform: Jaguar Cray XT3 at ORNL • 1p • 8p • 64p • 512p • Goal: to evaluate scaling properties of code regions • Scalability of MPI operations
Introduction to ParaProf: Main Window click left mouse button click right mouse button load all 1p, 8p, 64p, 512p profile datasets together % paraprof *.ppk
MPI_Wait - Jagged Edges Seen in 3D Window pattern repeatsevery 8 cpus! 512 cpus
Comparing MPI_Wait • MPI_Wait time increases steadily with processors!
PerfExplorer - Comparative Analysis • Relative speedup, efficiency • total runtime, by event, one event, by phase • Breakdown of total runtime • Group fraction of total runtime • Correlating events to total runtime • Timesteps per second
PerfExplorer TAU’s PerfDMF database S3D
Data Mining: Event Correlation to Total Time r = 1 implies direct correlation
S3D - Building with TAU • Change name of compiler in build/make.XT3 • ftn=> tau_f90.sh • cc => tau_cc.sh • Set compile time environment variables • setenv TAU_MAKEFILE /spin/proj/perc/TOOLS/tau_latest/xt3/lib/ Makefile.tau-callpath-multiplecounters-mpi-papi-pdt-pgi • Choose callpath, PAPI counters, MPI profiling, PDT for source instrumentation • setenv TAU_OPTIONS ‘-optTauSelectFile=select.tau -optPreProcess’ • Selective instrumentation file eliminates instrumentation in lightweight routines • Pre-process Fortran source code using cpp before compiling • Set runtime environment variables for instrumentation control and event PAPI counter selection in job submission script: • export TAU_THROTTLE=1 • export COUNTER1 GET_TIME_OF_DAY • export COUNTER2 PAPI_FP_INS • export COUNTER3 PAPI_L1_DCM • export COUNTER4 PAPI_RES_STL • export COUNTER5 PAPI_L2_DCM
Selective Instrumentation in TAU % cat select.tau BEGIN_EXCLUDE_LIST MCADIF GETRATES TRANSPORT_M::MCAVIS_NEW MCEDIF MCACON CKYTCP THERMCHEM_M::MIXCP THERMCHEM_M::MIXENTH THERMCHEM_M::GIBBSENRG_ALL_DIMT CKRHOY MCEVAL4 THERMCHEM_M::HIS THERMCHEM_M::CPS THERMCHEM_M::ENTROPY END_EXCLUDE_LIST BEGIN_INSTRUMENT_SECTION loops routine="#" END_INSTRUMENT_SECTION
Getting Access to TAU on Jaguar • set path=(/spin/proj/perc/TOOLS/tau_latest/x86_64/bin $path) • Choose Stub Makefiles (TAU_MAKEFILE env. var.) from /spin/proj/perc/TOOLS/tau_latest/xt3/lib/Makefile.* • Makefile.tau-mpi-pdt-pgi (flat profile) • Makefile.tau-mpi-pdt-pgi-trace (event trace, for use with Vampir) • Makefile.tau-callpath-mpi-pdt-pgi (single metric, callpath profile) • Binaries of S3D can be found in: • ~sameer/scratch/S3D-BINARIES • withtau • papi, multiplecounters, mpi, pdt, pgi options • without_tau
Concluding Discussion • Performance tools must be used effectively • More intelligent performance systems for productive use • Evolve to application-specific performance technology • Deal with scale by “full range” performance exploration • Autonomic and integrated tools • Knowledge-based and knowledge-driven process • Performance observation methods do not necessarily need to change in a fundamental sense • More automatically controlled and efficiently use • Develop next-generation tools and deliver to community • Open source with support by ParaTools, Inc. • http://www.cs.uoregon.edu/research/tau
Support Acknowledgements • Department of Energy (DOE) • Office of Science • LLNL, LANL, ORNL, ASC • PERI