Download

1 / 15
150 likes | 320 Views
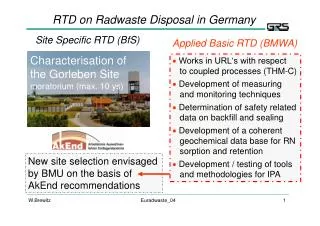
Site Specific Response Analyses and Design Spectra for Soft Soil Sites. I-15 NATIONAL TEST BED TECHNOLOGY TRANSFER SYMPOSIUM Highway Bridge and Geotechnical Innovations Salt Lake City, Utah Sept 17-18, 2003. Steven F. Bartlett, Ph.D., P.E. Amplification of pga on Soft Soil Sites.

E N D
Site Specific Response Analyses and Design Spectra for Soft Soil Sites I-15 NATIONAL TEST BED TECHNOLOGY TRANSFER SYMPOSIUM Highway Bridge and Geotechnical Innovations Salt Lake City, Utah Sept 17-18, 2003 Steven F. Bartlett, Ph.D., P.E.
Approach • Development of Subsurface Profile and Dynamic Soil Properites • Development of a Target Rock Spectrum • Selection of Time Histories • Scaling or Spectral Matching of Time Histories to Target Spectrum • 1-D Equivalent Linear Convolution Analysis • Development of Final Enveloping Design Spectra
The Vs model should be developed to a depth corresponding to site class C soils (1200 ft/s or 365 m/s) Deep Profile Depth To site class C (approx. 70 m)
Step 1Selection of Modulus and Damping Curves • Vucetic and Dobry (1991) for shallow • clayey and silty soils (requires estimate of PI) • Electric Power Research Institute (1993) sands • for deeper sediments (or other curves that account • for effective stress dependency)
Step 2Development of Target Rock Spectrum 2% Exceedance Probability in 50 yrs – Site Class B
Step 3Selection of Time Histories Considerations a. fault mechanism and tectonic regime b. earthquake magnitude (characteristic event) c. fault distance d. duration of strong ground motion e. site conditions (select rock records) f. fault directivity pulse (sites < 10 km) g. number of independent time histories required (5 to 7)
Step 4Spectral Matching • Spectral matching insures that the design time history has the proper amplitude and frequency content of the target spectrum. • RSPMATCH (Abrahamson, 1992) • RSPMATCH adjusts the initial accelerogram iteratively in the time domain to achieve compatibility with a specified target acceleration response spectrum. • RSPMATCH adds wave packets having specified period ranges and limited durations to the input time history.
Step 4Spectral Matching Comparison of Matched Spectrum to Target Spectrum
Step 5 – 1 D Convolution Analysis Surface Soil Response Site-Specific Profile Bedrock Spectrally matched time history assigned to bedrock layer as an outcropping rock motion. Assign 1 to 2 percent damping in the elastic bedrock layer.