Download
1 / 12
120 likes | 211 Views
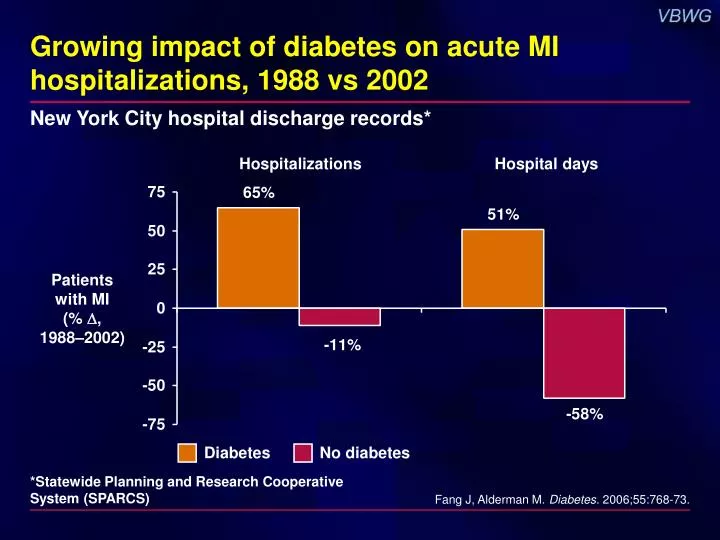
Growing impact of diabetes on acute MI hospitalizations, 1988 vs 2002. Diabetes. No diabetes. New York City hospital discharge records*. Hospitalizations. Hospital days. Patients with MI ( % , 1988–2002). *Statewide Planning and Research Cooperative System (SPARCS).

E N D
Growing impact of diabetes on acute MI hospitalizations, 1988 vs 2002 Diabetes No diabetes New York City hospital discharge records* Hospitalizations Hospital days Patients with MI (% , 1988–2002) *Statewide Planning and Research Cooperative System (SPARCS) Fang J, Alderman M. Diabetes. 2006;55:768-73.
IVUS shows greater atherosclerotic disease burden in diabetes Diabetes No diabetes N = 654 with CHD; 128 (19.6%) with diabetes P = 0.03 P = 0.01 P = 0.0002 % IVUS = intravascular ultrasound Nicholls SJ et al. J Am Coll Cardiol. 2006;47:1967-75.
ADA: Physical activity recommendations in type 2 diabetes and IGT T2DM = type 2 diabetes IGT = impaired glucose tolerance Sigal RJ et al. Diabetes Care. 2006;29:1433-8.
INVEST: Significant predictors of diabetes Reduced risk Increased risk Baseline Covariate HR 95% CI P Multiracial/other ethnicity 1.64 1.15–2.34 <0.01 US resident 1.62 1.37–1.91 <0.001 Left ventricular hypertrophy 1.27 1.10–1.46 <0.01 Prior stroke/TIA 1.26 1.03–1.58 0.03 Hispanic ethnicity 1.21 1.05–1.39 <0.01 Coronary revascularization 1.18 1.03–1.35 0.02 Hypercholesterolemia 1.17 1.04–1.31 0.01 BMI (5-kg/m2 increments) 1.05 1.04–1.06 <0.001 Age (10-yr increments) 0.90 0.85–0.96 <0.001 Strategy: verapamil SR (vs atenolol) 0.85 0.76–0.95 <0.01 0.5 1.0 1.5 2.0 2.5 HR (95% CI) TIA = transient ischemic attack Cooper-DeHoff R et al. Am J Cardiol. 2006;98:890-4.
INVEST: Follow up systolic BP associated with new diabetes N = 16,176 with CAD + hypertension, without diabetes 12 1.8 1.6 10 1.4 1.2 8 Patients developing diabetes (%) Estimated hazard ratio 1.0 6 0.8 4 0.6 0.4 2 0.2 0 0 <120 120 to <130 130 to<140 140 to<150 ≥150 SBP (mm Hg) Hazard ratio (P < 0.001) Incidence (%) Cooper-DeHoff R et al. Am J Cardiol. 2006;98:890-4.
Prevention of CV events with lipid lowering by diabetes status: Meta-analysis Diabetes No diabetes N = 80,862 with and without diabetes, 12 trials NNT Primary prevention Secondary prevention NNT = number needed to treat Costa J et al. BMJ. 2006;332:1115-24.
HPS: Statin beneficial irrespective of baseline lipid level and diabetes status Heart Protection Study Event rate (%) Simvastatin n = 10,269 Placebo n = 10,267 Statin better Placebo better LDL-C <116 mg/dL With diabetes 15.7 20.9 No diabetes 18.8 22.9 LDL-C ≥116 mg/dL With diabetes 23.3 27.9 No diabetes 20.0 26.2 24% reductionP < 0.0001 All patients 19.8 25.2 0.4 0.6 0.8 1.0 1.2 1.4 Event rate ratio HPS Collaborative Group. Lancet. 2003;361:2005-16.
CARDS: Statin reduces primary outcome N = 2838 with diabetes without CHD; LDL-C ≤160 mg/dL 15 RRR 37%(95% CI, 17%–52%) P = 0.001 Placebo127 events 10 Cumulativehazard(%) Atorvastatin83 events 5 0 0 1 2 3 4 4.75 Years Colhoun HM et al. Lancet. 2004;364:685-96.
TNT diabetic analysis: Treatment effects on LDL-C Treatment to New Targets; N = 1501 with CHD and diabetes 160 Atorvastatin 10 mg 28% (21.6 mg/dL) P < 0.001 160.0 120 96.7 98.6 Mean LDL-C (mg/dL) 80 95.6 77.0 Atorvastatin 80 mg 40 0 Run-inPhase Baseline Final 5 years 8 weeks *Open-label treatment atorvastatin with 10 mg Shepherd J et al. Diabetes Care. 2006;29:1220-6.
TNT diabetic analysis: First major CV event N = 1501 with CHD and diabetes 25 RRR 25% HR = 0.75 (95% CI 0.58–0.97) P = 0.026 Atorvastatin 10 mg 17.9% 20 Patients with major CV events* (%) 13.8% 15 Atorvastatin 80 mg 10 5 0 0 1 2 3 4 5 6 Years *CHD death, nonfatal non-procedural MI, resuscitated cardiac arrest, fatal/nonfatal stroke Shepherd J et al. Diabetes Care. 2006;29:1220-6.
TNT: MetS increases CV risk regardless of diabetes status N = 10,001 with CHD 20 15 HR 2.24 (1.87–2.68)P < 0.0001 Patientswith major CV event (%) 10 5 HR 1.35 (1.16–1.56)P < 0.0001 0 0 1 2 3 4 5 6 Time to first major CV event (years) MetS + diabetes (n = 1231) MetS, no diabetes (n = 4353) No MetS + diabetes (n = 270) No MetS, no diabetes (n = 4147) MetS = metabolic syndrome Deedwania P et al. Lancet. 2006;368:919-28.
AHA/ACC 2006 Secondary prevention guidelines: Risk factor modification in diabetes Smith SC et al. Circulation. 2006;113:2363-72.