Download

1 / 16
160 likes | 305 Views
ANNEX A - CQC Performance, Quarter 3, 2012. Contents Section 1 – Scorecard summary Slide 2 Section 2 – delivery priority 1: Deliver and Improve our regulatory and other functions Slides 3 - 8 Section 3 – delivery priority 3: Manage our organisation, people and resources Slides 9 - 10

E N D
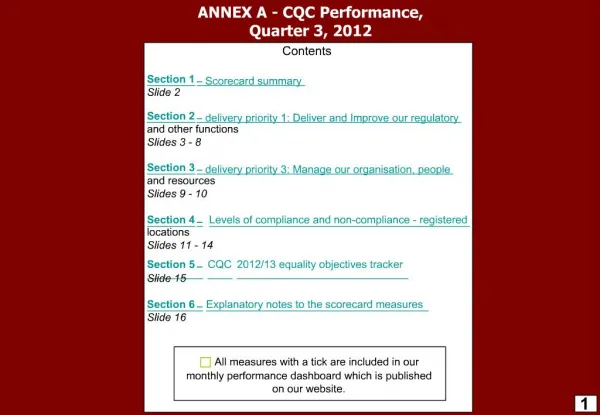
ANNEX A - CQC Performance, Quarter 3, 2012 Contents Section 1– Scorecard summary Slide 2 Section 2– delivery priority 1: Deliver and Improve our regulatory and other functions Slides 3 - 8 Section 3– delivery priority 3: Manage our organisation, people and resources Slides 9 - 10 Section 4–Levels of compliance and non-compliance - registered locations Slides 11 - 14 Section 5 –CQC2012/13 equality objectives tracker Slide 15 Section 6 –Explanatory notes to the scorecard measures Slide 16 All measures with a tick are included in our monthly performance dashboard which is published on our website. 1
Q3 and YTDscorecard summary Operating performance - Compliance inspections Operating performance - Registration, Enforcement and MHA Customer Service Resources and audit actions 2
CQC Performance – Q3, 2012– section 2, Deliver and Improve our regulatory and other functions Priority 1 – Deliver and improve our regulatory and other functions: Strengthen and improve the effectiveness and consistency of the regulatory model – Compliance, Enforcement and Registration Compliance Monitoring As at 31st December we were 75% of the way through the financial year and had completed 55.7%, (17,838) of our inspection delivery plancompared with a year to date profiled plan of 58% (18,539). Against the number of active locations we have met 61.6% of plan over the first 3 quarters, which leaves over 38% of plan to be inspected in Q4. As of 27th January there were 28,943 active locations (i.e. excluding those that made up the business plan target, but have since deregistered). This leaves 8,020 inspections to be completed in the next 9 weeks. Over the year productivity has improved significantly and additional resources have been made available in support of the programme delivery, however Q4 will be particularly challenging. The graph below illustrates the percentage of the plan by sector that must be delivered in Q4 to meet the overall business plan target. The second table on the left demonstrates the latest position (as at 27th January 2013 and compares the current weekly run rate and the required weekly run rate.) 179 Actual number of active locations remaining to be inspected 1,421 7,303 1,191 74 1 This is the profiled target to date- annual target is given numerically in the cells to the left 2 Based on including inspections from Q1,Q2 and Q3 that had less than 5 outcomes. 3
CQC Performance – Q3, 2012– section 2, Deliver and Improve our regulatory and other functions Priority 1 – Deliver and improve our regulatory and other functions: Strengthen and improve the effectiveness and consistency of the regulatory model – Compliance, Enforcement and Registration • Commentary: • The Regulatory Risk Committee has agreed to 4 thematic reviews this year covering: • Dementia • NHS data quality • Experiences of people waiting for NHS treatment and; • Physical health needs of people with a learning disability. • The review of dementia started in September and the remaining reviews are on track to report in March 2013. • The number of user voice QRP items is 48,703 this is an increase of 42% or 14,348 since Quarter1. • Although draft and final report timeliness has improved in comparison to Q2 when it was 64% and 65% respectively performance remains below plan for this year.The graphs below demonstrates that the plan for final reports was met in April, performance declined until September and then started to show improvement. The increase in performance is partly due to release 19 of CRM which provides detailed MI for compliance managers. 4
CQC Performance – Q3, 2012– section 2, Deliver and Improve our regulatory and other functions Priority 1 – Deliver and improve our regulatory and other functions: Strengthen and improve the effectiveness and consistency of the regulatory model – Compliance, Enforcement and Registration Commentary: The number of warning notices increased by 39% (or 78) in Q3 compared with Q2. Year to date there have been 651 warning notices issued compared to 396 for the same period last year an increase of 64%. The percentage of warning notices that are issued within 14 days of identifying one is required has remained fairly constant between Q2 and Q3 at 78.9% and 78.8% respectively. Year to date the figures is 83.8%. There were almost as many warning notices issued in the first three quarters of 2012/13 (651) than all 4 quarters of 2011/12, when there were 658. So far this year an average of 72 warning notices are issued each month, compared to an average of 55 per month last year. The graph below illustrates the number of warning notices issued on a quarterly basis since Q1, 2011/12. Notable legal action in Q3 included use of Section 30 of our Health and Social Care Act 2008 powers, to cancel the registration of a Nottinghamshire care home owner to stop them from being able to run a residential home to protect the safety and welfare of residents. CQC took this action because it had serious concerns about the service and the risks to the people using it. 3,798 locations that have de-registered since April 2012 of these 41 were due to CQC intervention. 5
CQC Performance – Q3, 2012– section 2, Deliver and Improve our regulatory and other functions Priority 1 – Deliver and improve our regulatory and other functions: Strengthen and improve the effectiveness and consistency of the regulatory model – Compliance, Enforcement and Registration Commentary: New provider and manager applications completed within 8 weeks remains within plan at 85.9% year to date. Meeting the 4week target for variation applications remains challenging.The graph below illustrates the weekly performance over the period from May 2012 to December 2012, although performance has improved from 65% at the beginning of May to 80% in December it remains below the 90% target. Improvement Line 6
CQC Performance – Q3, 2012– section 2, Deliver and Improve our regulatory and other functions Priority 1 – Deliver and improve our regulatory and other functions: Strengthen and improve the effectiveness and consistency of the regulatory model - Other inspections and mental health Commentary: Mental Health Act Operations - planned MHA Commissioner visitsremain ahead of schedule for the year to date - against a planned programme of 830 inspections in the first 9 months of the year, 842 have been completed. All complaint targets are also on track, year to date of 551 complaints about providers, 528 were triaged within 3 working days. SOAD indicators, M2 to M4, are reported one quarter in arrears to ensure data accuracy. The short- term- type contract relationship the CQC has with SOADs means that they will often complete a visit but not update the report on time. Q2 performance reflects only August and Septembers activity, the online forms that replaced the old manual reporting were delayed in being set up and as a result reporting against these measures (which were new and were not tracked manually) has been delayed. Overall SOAD performance was below plan, recruitment is on going to increase the number of available doctors. During the most recent recruitment process there were 80 SOAD candidates and of these 9 were successful at interview and attended an induction training session. The SOAD leadership will be strengthened to include a Principle SOAD and Operational manager to ensure robust challenge to the quality of second opinions provided. In Q2, 219 out of 330 SOAD medicines visits have been attended within 10 working days of receipt of request. 23 SOAD Electroconvulsive Therapy (ECT) visits out of 55 were attended within plan and, 30 out of 51 Community Treatment Order visits were done before the planed period of one. 7
CQC Performance – Q3, 2012– section 2, Deliver and Improve our regulatory and other functions Priority 1 – Deliver and improve our regulatory and other functions: Strengthen and improve the effectiveness and consistency of the regulatory model – Information and publication Commentary: NCSC call handling and quality - there have been almost 150,000 calls to the National Customer Service Centre in the first 9 months of the year, and all call handling targets are on track. The quality of service has been recognised by the ‘UK top 50’ call centres programme. This is the first year the Centre entered the programme and have been ranked 36th. Feedback from has been used to identify improvements to customer service with a view to incorporating benchmarks into the work of the NCSC. Call Volumes increased in Q3, partly due to calls from providers of primary medical services asking for assistance with their registration applications. Call Performance is consistently good across a range of indicators and is on track year to date. Publications, web and communication Year to date there have been almost 4.2m visits to our website of which almost 2.7m were unique visits. The ‘reports’ section of our website has been the most visited area in the first 9 months of the year. The most visited pages were; ‘reports surveys and reviews’ with 133,425 views, ‘contact us’ with 126,775 and the Job page with 107,630 views. The most popular downloads were ‘guidance about compliance’ with 82,639 downloads, the ‘Judgement framework’ ,15,867 and ‘table of statutory notifications under the Health and Social Care act’ ,11,412. All key publications have been published on target .Notably, the State of Care report was published during Q3, and received substantial and positive media attention. 8
CQC Performance – Q3, 2012– section 3, Manage our organisation, people and resources Priority 3 – Manage our organisation, people and resources Commentary: Vacancies and establishment - establishment increased in Q3 to 2,392 compared to 2,292 in Q1 reflecting the significant programme of recruitment of additional compliance inspectors. The Compliance inspector vacancy rate has improved significantly from 12.5% in Q1 to 0.4% in Q3 against a target of 2%. There is now a pipeline of candidates in place to fill future Compliance Inspector vacancies in all regions. The establishment and vacancy rate reflects the increase in staff, having improved from 14.8% in Q1 to 3.1% in Q3. overall vacancies have reduced from 339 in Q1 to 73 in Q3 a reduction of 78%. Compliance Inspector and Registration Assessor mandatory learning remains below target. HR is investigating this and a comprehensive skills audit will seek to understand the organisational mandatory training requirements and make recommendations for delivering improvements. Turnover and sickness rate Turnover improved significantly in Q3 to 0.3% compared to 1.8% in Q2 and year to date it stands at 0.3%. The sickness rate has increased marginally from 3.6% in Q1 to 4% in Q3, although performance remains within the 5% target. 1 Actual performance is the most recent fortnight reported, therefore not an average 2 The rolling year average ( Sept 2011- Sept 2012) for Turnover is 7.2%and 4% for the sickness rate 3 The annual target is 96%, the monthly target is cumulative and 8% per month 9
CQC Performance – Q3, 2012– section 3, Manage our organisation, people and resources Priority 3 – Manage our organisation, people and resources and governance Commentary: Complaint handling - Year to date there have been 318 stage one complaints, this is a decrease of 15% or 55 compared to the same period last year, when there were 373 stage one complaints received. The majority of complaints were from members of the public and service users. The number of stage 1 complaintsproceeding to stage 2 decreased in Q3 to 13. 77% of stage 2 complaintsin Q3 were closed within 20 working days compared with 100% in Q2. Year to date 81% of these complaints were closed against a target of 95%. There have been a number of complex stage 2 complaints considered by the Corporate Complaints team. Due to a small number of complaints received the percentage fall in Q3 only equates to 1 complaint. Statutory requests for information There have been almost 869 requests for statutory information in the first 9 months of the year. 835 or 96.1% were completed within the statutory deadlines. The majority, 619, were freedom of information requests. There were 143 information sharing request and 108 data protection Act requests. All measures are on track to achieve their 2012/13 business plan targets. Audit actions In the first 9 months of the year 95% of audit actions raised, were due to be completed by the end of December against a target of 90%. Revenue expenditure Year to date revenue expenditure shows an under spend of £6.9m (excluding fee income or 6%) consisting of staff costs of £5.4m, depreciation of £1.9m and an overspend on Non staff costs of £0.4M . 1 This figure is correct as of the last reported update in respect of year to date performance to August 10
CQC Performance –Q3, 2012– section 4, levels of compliance and non compliance at registered locations Number of locations in each sector that meet essential standards of quality and safety By sector – location level CQC Performance – April - June, Q1, 2012– compliance outcomes The graph to the left illustrates levels of compliance across all sectors. This graph should be viewed as a ‘snapshot’ at a given point across a range of variables, for example, which outcomes are reviewed and when, therefore it is not possible to make a perfect and direct comparison quarter on quarter. However by means of an overview, a comparison with other quarterly snapshots demonstrates that - at the end of Q3 there were 20,133 compliant locations compared with 17,292 in Q2. 16,156 locations have not yet had an inspection (compared with 23,306 in Q1) and 4,795 were non compliant with at least one outcome. Year to date there have been 651 warning notices served to 422 providers, 41 locations have de-registered following intervention by the CQC (compared to 21 in Q2) and there have been 3 urgent suspensions of registration, or urgent variation or imposition of conditions using Section 31 powers. 11
CQC Performance – Q3, 2012– section 4, compliance outcomes Levels of compliance and non-compliance - registered locations NHS locations non-compliant with one or more outcomes, by age Non compliance is broken down by sector and period. On the table on the left, the column ‘Q4 2011/12’ demonstrates the number that were non compliant by age at the end of that quarter. The row ‘less than one quarter’ shows that there were 34 non compliant NHS locations at the end of Q4, tracking this group by following the arrow shows that the number of these that were non compliant fell in Q1 2012/13 to 29 and then again to 14 in Q2 2012/13 and 11 in Q3 2012/13. The graph illustrates the total number of locations that were non compliant in each quarter. There was a decrease in total non compliant locations in Q1 and Q2 and then an increase in Q3, this may or may not be related to the increase in inspections in Q3. This data includes locations consistently non-compliant with a single outcome and locations that were non-compliant at the beginning of several quarters but with different outcomes. Some of the latter group may have returned to compliance during a quarter, only to become non-compliant again by the time the data is captured at the beginning of the next quarter. Further analysis is being undertaken to review the movements in compliance, evaluate the effectiveness of actions, non compliance across outcomes and the variation across sectors. The following two slides are in the same layout as this slide and illustrate the levels of compliance at ASC (slide 13) and IHC, Ambulance and dentist locations (slide 14) Note that these slides must be viewed in the context of time lags between inspection and final publication of the report and also the lag to re-inspection following identification of non-compliance 12
CQC Performance – Q3, 2012– section 4, compliance outcomes Levels of compliance and non-compliance - registered locations ASC locations non-compliant with one or more outcomes, by age Note that these slides must be viewed in the context of time lags between inspection and final publication of the report and also the lag to re-inspection following identification of non-compliance 1 The increase in ASC Q4 to Q1 is due to a small difference in the time range between the two sets of data used for the report. 13
CQC Performance – Q3, 2012– section 4, compliance outcomes Levels of compliance and non-compliance - registered locations IHC, Primary Dental Care and Independent Ambulance, locations non-compliant with one or more outcomes, by age Note that these slides must be viewed in the context of time lags between inspection and final publication of the report and also the lag to re-inspection following identification of non-compliance 14
CQC Performance – Q3, 2012,– section 4, equality outcomes All priorities – corporate equality objectives This is the third update against the equality objectives. Notable progress compared to the objectives has been included below as well as risks and issues to delivery. Objective 1: The ET and Board received quarterly updates covering our equality objectives as part of the overall performance governance of CQC. Objective 2: A plan from the evaluation of equality and human rights in compliance reviews was carried out in Q3 and will be implemented from Q4. Objective 3: A project plan, governance group and monitoring have been established to deliver this priority - identified work streams are currently on course. A reference group was set up and analytical resources allocated to deliver pilot of quantative indicators for the NHS. The report on availability of equality information on priorities and actions for next stage of work has been completed. Work is ongoing on the new mental health minimum dataset and on the multi-agency design of learning disability data collection set. Objective 4: Work is underway to monitor diversity of CQC involvement mechanisms and address gaps including: monitoring Speak Out network areas of interest in line with protected characteristics (Speak Out includes many of the seldom heard equality groups such as refugees, transgender people and gypsies and travellers) eQuality Voices recent recruitment of 10 new members to fill identified gaps including transgender people, carers of older people and refugees, Acting Together - Support organisations carry out equality monitoring and we are investigating best ways to bring this together and identify gaps for future expert by experience recruitment Objective 7: An analysis of staff profile has recently been completed for our annual equality information report (including for the first time analysis by pay grade). Work is underway with staff equality networks on the equality action plan arising from the staff survey may identify action we need to take in relation to making the profile more representative. Learning and development and the Race Equality Network are working together to develop opportunities for career development for Black and Minority ethnic staff. Objective 8: This objective is rated as amber overall to reflect the significant work required in this area following the 2012 staff survey. To assess work to date a proposed ‘pulse check’ for 500 staff of 20 questions is being prepared and will be presented to ET in late February. Work is underway to identify specific action required to take around bullying and harassment for particular staff groups, such as disabled staff, through the Staff Survey Equality Action Plan development. In Q3 HR appointed named officers for staff to talk to, during bullying and harassment week and they are planning other actions to improve support to staff who feel that they have been bullied or harassed. Objectives 9: Staff undertake equality training at the induction, this takes the form of an interactive session called equally yours, which includes updates to focus upon inclusion and using external networks. There is further work to improve the guidance that was identified following feedback, this means that some of the work will be delivered slightly later than planned. 15
CQC Performance – section 6, understanding the scorecard • A document with public to technical definitions of our corporate measures has been completed and is available on the intranet. This section is intended as an accessible guide to the overall performance areas in this report. • Compliance • A key part of our regulatory work is carrying out inspections to determine whether services are meeting the government standards. Our inspections focus on the outcomes that we expect people to experience when they use a service and assess the care, treatment and support they receive. Inspections include information from a range of sources including service users, the public, commissioners and other regulators. The measures in this section monitor the commitments we made to inspect services this year. • Our inspections of NHS Trusts include inspecting acute hospitals. The term 'acute' is used when referring to active care or treatment (usually in secondary care) to adults, children, or both, that requires urgent or emergency care, usually within 48 hours of admission or referral from other specialties, and includes recovery time from surgery. • Our publication ‘How CQC regulates’ was published alongside our business plan and explains the types of inspection we undertake: • Scheduled inspections are planned by CQC in advance and can be carried out at any time. • Follow up inspections are made when we want to check whether the provider has made improvements we are requiring them to make • Responsive inspections are where inspectors inspect because of a specific and immediate concern. • Themed inspections are where we look at a particular type of care or issue across one or more care sectors, for example dignity and nutrition in NHS hospitals, or care for people with a learning disability in both care homes and hospitals. • Complaints • The CQC welcomes comments and suggestions about performance and the conduct of staff, including complaints about the CQC. Every complaint is investigated, and the feedback used to develop and improve the Commissions services. These measures demonstrate the volume, efficiency and overall effectiveness of how complaints are handled. Enforcement We have a variety of enforcement powers available to us where we find a service is not meeting one or more of the standards. When we exercise these powers we do so in a proportionate way, considering the effect on the public and those who use services. This suite of powers enables us to take swift, targeted action where services are failing the people who use them. We report in our scorecard on the enforcement actions we have taken. A detailed description of our enforcement actions is available on our website. One of the most often used of our enforcement powers is a Warning notice. A warning notice tells a 'registered person' that they are not complying with a condition of registration, requirement in the Act or a regulation or any other legal requirement we think is relevant. They can be published if the provider has been given the opportunity to make representations and where those representations if made are not upheld. Our enforcement powers also include suspending or cancelling the service’s registration, or prosecution. Equality Setting equality objectives is a requirement for public sector bodies under the Equality Act 2010 specific duties regulations. The objectives that we have set for the CQC are stretching and they focus on the biggest equality challenges that we face. The objectives are listed here and are reported quarterly, they will track delivery of supporting work against each objective. FinanceOur finance measures cover high level expenditure against budget and how effective the Commission is at collecting fees due. Human Resources The indicators in this area demonstrate the overall key human resources performance areas and cover, vacancy rate, staff turnover, the sickness rate and the Commission's establishment Publication The Commission publishes information about the services it regulates on the CQC website. It also produces a number of publications each year covering reports, surveys, themed inspections, reviews and studies. These measures indicates how well the Commission is in getting information to people in a timely way. Mental Health We protect the rights of people being treated under the Mental Health Act. Our aim is to improve the outcome for every person who uses care services commissioned under the Act. Indicators in this area cover, Commissioner visits, second opinion appointed doctor service and complaints from service users about providers. Commissioner's visit wards that detain people under the Mental Health Act. They meet patients and ensure staff use their powers appropriately. These measures track the Commission's performance against the number of visits planned. The SOAD service safeguards the rights of patients detained under the Mental Health Act who refuse the treatment prescribed to them or are deemed incapable of consenting. The role of the SOAD is to decide whether the treatment recommended is clinically defensible and if consideration has been given to the views and rights of the patient. National Customer Service Centre The National Customer Service Centre (NCSC) is the first point of contact for members of the public, service users and providers. These measures demonstrate the level of efficiency of the NCSC in terms of the speed at which we respond to the calls we receive and how they are prioritised, as well as the volume of calls we respond to. Other Inspections The Commission has the power to inspect a range of other specific areas, all of the measures in this area track our delivery of inspection activity against our plan. IR(ME)R - the Ionising Radiation (Medical Exposure) Regulations, our inspections monitor the use of ionising radiation for medical exposure. Controlled drugs covers a range of areas including assessing and overseeing how health and social care providers manage controlled drugs. The Pharmacy team supports Compliance function in specific activities relating to controlled drugs. There are also a number of joint inspections were the CQC work with other regulators, for example a 3 year programme of inspections covering all local authority areas in terms of their provisions for child safeguarding and looked after children with Ofsted, and joint inspections with HM Inspectorate of Prisons and HM Inspectorate of Probation. Registration To be registered with the CQC, providers must meet the essential standards of quality and safety for each regulated activity they provide at each location. Providers will not be registered if they cannot declare full compliance. These measures capture the efficiency of the Commission in processing these applications. 16