Understanding Air Pollution and its Impact on the Atmosphere
Learn about different layers of the atmosphere, major air pollutants, primary and secondary pollutants, natural and stationary sources, urban outdoor air pollution, major pollutants, indoor air pollution, and mitigation techniques.

Understanding Air Pollution and its Impact on the Atmosphere
E N D
Presentation Transcript
Atmospheric pressure (millibars) Temperature Pressure Thermosphere Mesopause Heating via ozone Mesosphere Altitude (kilometers) Altitude (miles) Stratopause Stratosphere Tropopause Ozone “layer” Heating from the earth Troposphere Pressure = 1,000 millibars at ground level (Sea level) Temperature (˚C) Fig. 19-2, p. 440
Layers of the Atmophere • Thermosphere: Closest to the surface of the Earth. This is where all weather and air travel occurs. Most pollutants affect this layer. Has the highest concentration of molecules • Stratosphere: Contains the ozone layer which absorbs incoming UV radiation • Mesosphere: temperature decreases with altitude • Thermosphere: Warmed by the sun, lowest air pressure of the layers
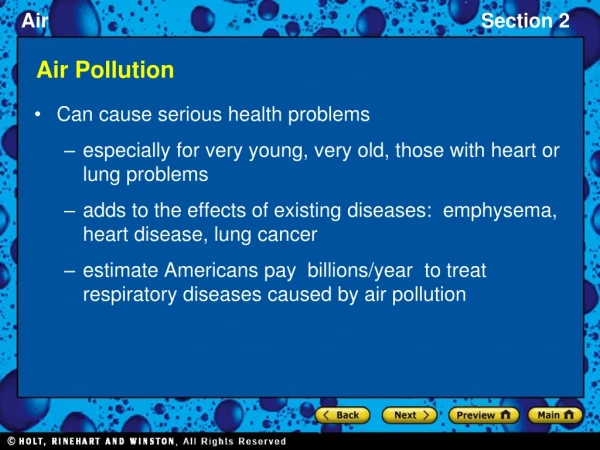
Major Air Pollutants • Nitrogen Oxides • Carbon Oxides • Sulfur Oxides • Particulates • Ozone • PANS • Volatile Organic Compounds (VOCs) • Radon (Indoor air pollutant)
Primary Pollutants Pollutants that retain the same chemical formula from the source to the atmosphere methane, SO2, CO, CO2, NO, dust particles, microorganisms, and chlorofluorocarbons (CFC’s) Causes of Primary Pollutants – factories, cars, wind and soil, volcanoes, forest fires, pollen, decaying plants, salt particles from the sea, and refrigerants.
Primary Pollutants Secondary Pollutants CO CO2 SO2 NO NO2 SO3 Most hydrocarbons HNO3 H3SO4 Most suspended particles H2O2 O3 PANs Most NO3– and SO42– salts Natural Stationary Sources Mobile Fig. 19-3, p. 442
URBAN OUTDOOR AIR POLLUTION • Industrial smog is a mixture of sulfur dioxide, droplets of sulfuric acid, and a variety of suspended solid particles emitted mostly by burning coal. • In most developed countries where coal and heavy oil is burned, industrial smog is not a problem due to reasonably good pollution control or with tall smokestacks that transfer the pollutant to rural areas.
Sunlight plus Cars Equals Photochemical Smog Photochemical smog is a mixture of air pollutants formed by the reaction of nitrogen oxides and volatile organic hydrocarbons under the influence of sunlight.
Sunlight plus Cars Equals Photochemical Smog Mexico City is one of the many cities in sunny, warm, dry climates with many motor vehicles that suffer from photochemical smog. Figure 19-4
Temperature Inversions Cold, cloudy weather in a valley surrounded by mountains can trap air pollutants (left). Areas with sunny climate, light winds, mountains on three sides and an ocean on the other (right) are susceptible to inversions. Figure 19-5
Major Air Pollutants • Suspended particulate matter (SPM): • Consists of a variety of solid particles and liquid droplets small and light enough to remain suspended in the air. • The most harmful forms of SPM are fine particles (PM-10, with an average diameter < 10 micrometers) and ultrafine particles (PM-2.5). • According to the EPA, SPM is responsible for about 60,000 premature deaths a year in the U.S.
Major Air Pollutants • Volatile organic compounds (VOCs): • Most are hydorcarbons emitted by the leaves of many plants and methane. • About two thirds of global methane emissions comes from human sources. • Other VOCs include industrial solvents such as trichlorethylene (TCE), benzene, and vinyl chloride. • Long-term exposure to benzene can cause cancer, blood disorders, and immune system damage.
Major Air Pollutants • Radon (Rn): • Is a naturally occurring radioactive gas found in some types of soil and rock. • It can seep into homes and buildings sitting above such deposits.
INDOOR AIR POLLUTION • Indoor air pollution usually is a greater threat to human health than outdoor air pollution. • According to the EPA, the four most dangerous indoor air pollutants in developed countries are: • Tobacco smoke. • Formaldehyde. • Radioactive radon-222 gas. • Very small fine and ultrafine particles.
Para-dichlorobenzene Chloroform Tetrachloroethylene Formaldehyde 1, 1, 1- Trichloroethane Styrene Nitrogen Oxides Benzo-a-pyrene Particulates Tobacco Smoke Radon-222 Asbestos Carbon Monoxide Methylene Chloride Fig. 19-11, p. 453
INDOOR AIR POLLUTION • Household dust mites that feed on human skin and dust, live in materials such as bedding and furniture fabrics. • Can cause asthma attacks and allergic reactions in some people. Figure 19-12
Case Study: Radioactive Radon Sources and paths of entry for indoor radon-222 gas. Radon-222, a radioactive gas found in some soils and rocks, can seep into some houses and increase the risk of lung cancer. Figure 19-13
Radon Mitigation • Vent air
Mitigation Techniques • Wet Scrubbers – removes particulates & Sulfur oxides
Mitigation Techniques • Electrostatic Precipitators http://www.bbc.co.uk/schools/gcsebitesize/science/images/ph_elect28.gif
Mitigation Techniques • Mechanical Filters • Air filters like your furnace filter, car filter • Remove particulates from the air. Particulates removes depends on the quality of the filter.
Mitigation Techniques • After-burners – used for VOCs and particlute pollution control • Breaks down the molecular structure into CO2 and Water Vapor • Used often for Methane (CH4) • May be used for energy http://depts.washington.edu/centc/research_methane.htm
Acid Deposition • Acid Rain caused by sulfur dioxide emissions • Sulfur dioxide in the atmosphere reacts with water vapor to form sulfuric acid: SO2 + H2O -> H2SO4
ACID DEPOSITION Acid deposition consists of rain, snow, dust, or gas with a pH lower than 5.6. Figure 19-6
ACID DEPOSITION pH measurements in relation to major coal-burning and industrial plants. Figure 19-7
ACID DEPOSITION • Environmental Effects: • Erosion • Leaching of toxic metals (such as lead and mercury) from soils and rocks into acidic lakes used as sources for drinking water • Disruption of aquatic ecosystems
ACID DEPOSITION Health effects: Acid deposition contributes to chronic respiratory disease and
ACID DEPOSITION Figure 19-8
ACID DEPOSITION Figure 19-9
Mitigation Techniques • Add neutralizing base to acidic water – Lime is a good base to use • Add phosphate fertilizer which raises the pH level of the water
Solutions Acid Deposition Prevention Cleanup Reduce air pollution by improving energy efficiency Add lime to neutralize acidified lakes Reduce coal use Add phosphate fertilizer to neutralize acidified lakes Increase natural gas use Increase use of renewable energy resources Burn low-sulfur coal Remove SO2 particulates & NOx from smokestack gases Remove NOx from motor vehicular exhaust Tax emissions of SO2 Fig. 19-10, p. 452
OZONE DEPLETION IN THE STRATOSPHERE • Less ozone in the stratosphere allows for more harmful UV radiation to reach the earth’s surface. • The ozone layer keeps about 95% of the sun’s harmful UV radiation from reaching the earth’s surface. • Chlorofluorocarbon (CFCs) have lowered the average concentrations of ozone in the stratosphere. • In 1988 CFCs were no longer manufactured.
Ultraviolet light hits a chlorofluorocarbon (CFC) molecule, such as CFCl3, breaking off a chlorine atom and leaving CFCl2. Sun Cl Once free, the chlorine atom is off to attack another ozone molecule and begin the cycle again. UV radiation A free oxygen atom pulls the oxygen atom off the chlorine monoxide molecule to form O2. The chlorine atom attacks an ozone (O3) molecule, pulling an oxygen atom off it and leaving an oxygen molecule (O2). The chlorine atom and the oxygen atom join to form a chlorine monoxide molecule (ClO). Summary of Reactions CCl3F + UV Cl + CCl2F Cl + O3 ClO + O2 Cl + O Cl + O2 Repeated many times Fig. 20-18, p. 486
OZONE DEPLETION IN THE STRATOSPHERE During four months of each year up to half of the ozone in the stratosphere over Antarctica and a smaller amount over the Artic is depleted. Figure 20-19
OZONE DEPLETION IN THE STRATOSPHERE Since 1976, in Antarctica, ozone levels have markedly decreased during October and November. Figure 20-20
OZONE DEPLETION IN THE STRATOSPHERE • Ozone thinning: caused by CFCs and other ozone depleting chemicals (ODCs). • Increased UV radiation reaching the earth’s surface from ozone depletion in the stratosphere is harmful to human health, crops, forests, animals, and materials such as plastic and paints.
Natural Capital Degradation Effects of Ozone Depletion Human Health • Worse sunburn • More eye cataracts • More skin cancers • Immune system suppression Food and Forests • Reduced yields for some crops • Reduced seafood supplies from reduced phytoplankton • Decreased forest productivity for UV-sensitive tree species Wildlife • Increased eye cataracts in some species • Decreased population of aquatic species sensitive to UV radiation • Reduced population of surface phytoplankton • Disrupted aquatic food webs from reduced phytoplankton Air Pollution and Materials • Increased acid deposition • Increased photochemical smog • Degradation of outdoor paints and plastics Fig. 20-21, p. 488 Global Warming • Accelerated warming because of decreased ocean uptake of CO2 from atmosphere by phytoplankton and CFCs acting as greenhouse gases
Case Study: Skin Cancer Structure of the human skin and relationship between radiation and skin cancer. Figure 20-22
Law – Clean Air Act 1963 - first passage 1970, 1977 and 1990 - amended Involves EPA Sets standards for acceptable levels of sulfur oxides, nitrogen oxides, ozone, carbon monoxide, hydrocarbons, lead, & more Provides pollution credits for industries that utilize pollution-control devices It established NAAQS and AQI Clean Air Act: EPA
National Ambient Air Quality Standards (NAAQS) • Sets acceptable concentrations for 6 “criteria” pollutants that: • Threaten public health/the environment over broad areas (non-point) • Are emitted in large quantities • CO, Pb, Nitrogen Oxides, Ozone, Particulate Matter and Sulfur Dioxides
Air Quality Index (AQI) Measures levels of 5 criteria pollutants Forecast of daily air pollution levels Purpose to educate and protect public- focuses on health effects Categories: green= good, yellow= moderate, orange= unhealthy for sensitive groups, red= unhealthy, purple= very unhealthy
National Emissions Standards for Hazardous Air Pollutants Regulates emissions (from point sources) For specific substances (air toxics w/ known or suspected serious health effects (mutagens, carcinogens, neurotoxins) Tend to be localized, from point sources Examples: Ammonia, chlorine, asbestos, arsenic, mercury, benzene