ECONOMICS
160 likes | 329 Views
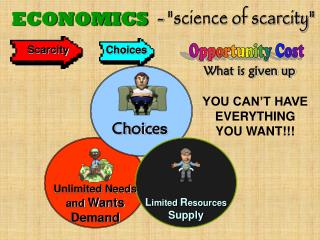
ECONOMICS. CHAPTER 3, SECTION 1- THE NATURE OF DEMAND. I. Demand. A. Demand (D) is the amount of a good or service a consumer is willing and able to purchase at various prices during a given period of time. W + A = D. I. Demand.

ECONOMICS
E N D
Presentation Transcript
ECONOMICS CHAPTER 3, SECTION 1- THE NATURE OF DEMAND
I. Demand • A. Demand (D) is the amount of a good or service a consumer is willing and able to purchase at various prices during a given period of time. W + A = D
I. Demand • B. Quantity Demanded (QD) is the amount of a good or service a consumer is willing and able to purchase at each price during a given period of time.
I. Demand • C. What is the difference between D and QD? • D measures W + A at various prices. • QD measures W + A at one (particular) price.
II. The Law of Demand • A. When the price of a good or service increases, the quantity demanded decreases. • When the price of a good or service decreases, the quantity demanded increases. • B. This is an inverse (opposite) relationship.
II. The Law of Demand P QD P QD
III. Demand Schedule • A. A demand schedule illustrates the relationship between the price of a good or service and the quantity demanded for the good or service. • B. The demand schedule shows the law of demand.
IV. Demand Graphs • A. A demand graph is a graphic illustration of the demand schedule. • B. A demand curve plots the information from the demand schedule on to the demand graph. • C. Each plotted point on the graph represents a specific combination of price and quantity demanded. • D. The demand curve slopes downward, right.
10,000 8,000 P 6,000 4,000 2,000 D 0 1,000 1,200 1,500 3,000 5,000 QD
V. Examples of the Law of Demand • A. The Income Effect • 1. Purchasing Power-The amount of money one has available to spend on goods and services. • 2. Any change in a consumers’ purchasing power which is caused by a change in price • 3. The income effect may not always apply.
V. Examples of the Law of Demand PP D PP D
V. Examples of the Law of Demand • B. The Substitution Effect • 1. Substitute goods-Goods that can be used in place of one another. • 2. Consumers tend to substitute a similar, lower-priced good for another good that is higher-priced. • 3. The substitution effect may not always apply.
V. Examples of the Law of Demand P (original good) D (substitute good) P (original good) D (substitute good)
V. Examples of the Law of Demand • C. Diminishing Marginal Utility • 1. Utility-Usefulness or satisfaction gained from the consumption of a good or service. • 2. With each additional unit of consumption of a good or service, less satisfaction from each unit of consumption will be received.
V. Examples of the Law of Demand • 3. Demand will decrease because at some point, consumers cannot use any more of a good or service.