Download
1 / 27
270 likes | 425 Views
P artnership for E nvironmental R esearch and C ommunity H ealth. PERCH Air Quality Study – PAQS. Special thanks to Carl Mohrherr Alan Knowes Staff of OJSES FL-DOH FL-DEP SEARCH. Southern Oxidants Study Fall line Air Quality Study Atlanta Supersite Texas Air Quality Study 2000

E N D
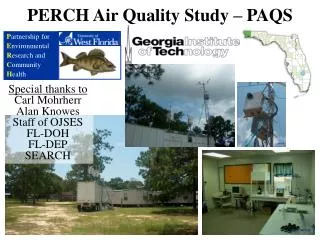
Partnership for Environmental Research and Community Health PERCH Air Quality Study – PAQS Special thanks to Carl Mohrherr Alan Knowes Staff of OJSES FL-DOH FL-DEP SEARCH
Southern Oxidants Study Fall line Air Quality Study Atlanta Supersite Texas Air Quality Study 2000 Southern Appalachian Mountain Initiative Atlanta Ozone Forecasting Southern Center for the Integrated Study of Secondary Air Pollutants Air Resources Engineering Center Karsten Baumann Michael Bergin Ann Bostrom Carlos Cardelino Bill Chameides Michael Chang Talat Odman Rick Peltier Mohan Turaga Ted Russell Rodney Weber Air QualityExperience
Partnership for Environmental Research and Community Health What’s the problem? Is there a problem? PERCH Mission: to determine if a connection exists between elevated levels of illness in Northwest Florida and the levels of toxic pollutants in the area. Could the air be making people sick or causing premature death?
PERCH Air Quality Study – Phase I • Scope: air toxics, ozone, and particulate matter. • Identify, compile, and assess existing emissions and ambient air data from US EPA, FL DEP, and private (e.g. SEARCH). • Review existing studies (particularly National Air Toxics Assessment and Gulf Coast Ozone Study). Any gaps? • Complete a health impacts literature search. • Screen for potential health risks due to realized and potential ambient exposures. • Design and conduct field pilot study in Phase II.
Deployment of GA Tech’s Mobile LabPeriod: 15 July - 14 August, 2003 UWF OLF ELY OJ Semmes ES PNS WAR NVR NAS
Wed Thu Fri Sat Sun Mon Tue Wed Pollutants in the Region Around August 9-10 Weekend
OLFUWFELY OJS PNSNASNVR Diurnal Characteristics: Averages, Std.Dev. • Convective winds • Sporadic SO2 events • Bimodal CO and NOy • Similar daytime O3 maxima at all sites • Less nighttime O3 titration at NAS shoreline • Trend to higher PM2.5 mass in southern part
OLFELYPNS OJS NASNVR Diurnal Characteristics of Winds • Indications for land-sea breeze circulation at shore sites NAS and NVR, with southerly component flow at daytime, northerly at night. • Land-sea breeze influence weakens further inland. • Indications for “convergence” with synoptic westerlies.
Transport from Local and Distant SourcesWind Frequency Distributions OLF ELY OJS WAR PNS NVR NAS
Transport from Local and Distant SourcesWind Speed OLF ELY OJS WAR PNS NVR NAS
Transport from Local and Distant SourcesSulfur Dioxide (SO2) ELY UWF OLF OJS PNS WAR NVR NAS
Transport from Local and Distant SourcesCarbon Monoxide (CO) OLF UWF ELY OJS PNS NVR WAR NAS
Transport from Local and Distant SourcesNitrogen Oxides (NOx & NOy) UWF ELY OLF OJS PNS WAR NVR NAS
Transport from Local and Distant SourcesOzone (O3) ELY OLF OJS WAR PNS NVR NAS
Transport from Local and Distant SourcesFine PM Mass (PM2.5) OLF ELY OJS PNS NVR NAS
Air Toxics from VOC can samples Halogenated HCs F-114 F-11 F-113 CCl4 AVG STD Aromatics Benzene Toluene Ethylbenzene m-xylene p-xylene o-xylene 1,3-butadiene 4-ethyltolene 1,3,5-trimethylbenzene 1,2,4-trimethylbenzene AVG STD
Photochemical Processes Leading to O3 and PM An Assessment of Tropospheric Ozone Pollution, A North American Perspective, NARSTO, National Acad. Press, 2000. NOz SOA
downwind Atlanta JST Griffin Photochemical ActivitySource – Receptor Considerations: O3/NOz as “OPE” Elevated regional O3 background reflected in regression’s intercept: higher in Aug 99! At JST higher intercept and slope during Aug ’99 (OPE= 4 vs 3): more efficient P(O3). OPE in air mass arriving at Griffin is likely larger given by upper and lower limits. Lower limit assumes 1st order loss of HNO3 due to surface deposition at k ≈ 0.22 h-1.
OPE Considerations for Pensacola Crude midday OPE is very similar for both sites, indicating moderate OPE. A much more refined analysis is required for true OPE. Intercept indicating relatively low background O3 level.
Secondary organic aerosol (SOA): Organic compounds, some highly oxygenated, residing in the aerosol phase as a function of atmospheric reactions that occur in either gas or particle phases. SOA formation mainly depends on: Emissions & forming potential of precursors aromatics (BTX, aldehydes, carbonyls) terpenes (mono-, sesqui-) other biogenics (aldehydes, alcohols) Presence of other initiating reactants O3, OH, NO3, sunlight, acid catalysts Mechanisms (with half hr to few hr yields): Gas-to-particle conversion/partitioning e.g. terpene oxidation Heterogeneous reactions aldehydes via hydration and polymerization, forming hemiacetal/acetal in presence of alcohols Particle-phase reactions acetal formation catalytically accelerated by particle sulfuric acid (Jang and Kamens, ES&T, 2001)
Particle Composition Monitor “PCM” Channel 1: NH3 Na+, K+, NH4+, Ca+2 Channel 2: HF, HCl, HONO, HNO3, SO2, HCOOH, CH3COOH, (COOH)2 F-, Cl-, NO3-, SO4=, HCOO-, CH3COO-, C2O4= Channel 3: EC, OC, WSOC, “SVOC” Additional higher resolutionCO, NO, NOy, O3,PM-mass, and basic meteorology
Preliminary Findings and Outlook • Period 7/15-8/14 characterized by frequent precipitation • Period has been unseasonably wet for SE-US • Leading to low [O3] and [PM2.5] region-wide • Land-sea breeze circulation most prominent at shore sites • Sea breeze (southerly flow) converging with westerlies on middays • Highest [O3] associated with southerly component flow at all sites • Highest [PM2.5] with continental air mass during dry period at end • OJS predominantly influenced by mobile sources • Sporadic SO2 events during morning BL evolution • Integrate, further evaluate PILS-IC, VOC, FLDEP, SEARCH data • Relate air toxics to other compounds/sources • Complete fine PM mass and composition analyses • Find resources for transition metals analyses (ICP-MS) • Analyze back trajectories for certain episodes • Analyze P(O3)/OPE for late episode of regionally high PM • Assess fraction of SOA from mass balance • Help integrate data for comprehensive exposure/health risk analysis • Listen to what is needed!!
Questions, comments, suggestions? • Dr. Karsten Baumann kb@eas.gatech.edu • Dr. Michael Chang chang@eas.gatech.edu • Dr. Ranga Rao rrao@uwf.edu