Download
1 / 30
310 likes | 692 Views
Equations of straight lines. Objective: To be able to find the equation of straight lines. 5. 4. 3. 2. 1. -5. -4. -3. -2. -1. 0. 1. 2. 3. 4. 5. -1. -2. -3. -4. -5. Coordinates. y. X = 3. 5. 4. All points on this line have the x-coordinate ‘3’. 3. 2. 1. x. -5. -4.

E N D
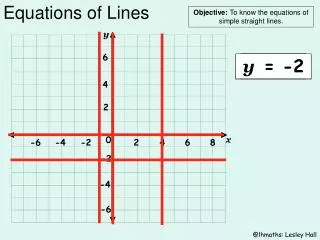
Equations of straight lines Objective: To be able to find the equation of straight lines.
5 4 3 2 1 -5 -4 -3 -2 -1 0 1 2 3 4 5 -1 -2 -3 -4 -5 Coordinates
y X = 3 5 4 All points on this line have the x-coordinate ‘3’ 3 2 1 x -5 -4 -3 -2 -1 0 1 2 3 4 5 -1 -2 All points on this line have the y-coordinate ‘-2’ -3 -4 -5 Naming horizontal and vertical lines y = -2
Thursday 24th FebruaryEquations of straight lines. Objective: to be able to give the equation of any straight line. Page 188, Question 3. Write down the equation of each line on the grid. You do not need to copy out the grid. You have exactly 5 minutes to complete all 8
Solutions • (e) y = 6 • (f) y = 4 • (g) y = -3 • (h) y = -5 • (a) x = -9 • (b) x = -5 • (c) x = 4 • (d) x = 8
y 5 4 3 2 1 x -5 -4 -3 -2 -1 0 1 2 3 4 5 -1 -2 -3 -4 -5 These points are on a straight line. Naming sloping lines They have coordinates (-5,0), (-3,2) and (-1,4) To find the equation of the line, find a rule connecting the x-coordinate and the y-coordinate. (-5 , 0) (-3 , 2) (-1 , 4) +5 +5 +5 The rule to find the y-coordinate is ‘add 5 to the x-coordinate’ The equation of the line is y = x + 5
y 5 4 3 2 1 x -5 -4 -3 -2 -1 0 1 2 3 4 5 -1 -2 -3 -4 -5 The equation of the line is x + y = 4 Coordinates: (0 , 4) (1 , 3) (3 , 1) 0 + 4 = 4 1 + 3 = 4 3 + 1 = 4 The rule is ‘x-coordinate plus y-coordinate equals 4’
Writing equations Copy the following rules and re-write them as equations: y = x + 5 y = x - 3 x + y = 7 y = 3x - 4
Page 190, Exercise 12E. Questions 1 & 2 Find the equations of the lines on the grids. You do not need to copy out the grids.
What is the equation of the line through: F and G? A and B? x + y = 15 is the equation of the line through which points? The octagon has 4 lines of symmetry. What are their equations?
Friday 25th February Objective: To be able to find the equations of sloping lines To be able to draw sloping lines from their equations.
y 5 4 3 2 1 x -5 -4 -3 -2 -1 0 1 2 3 4 5 -1 -2 -3 -4 -5 y = x+2 y = x y = -x y + x = -2 y = 0 x = 0 x = 2
Sloping lines with different gradients. Gradient is the mathematical word for steepness. The bigger the gradient, the steeper the slope of the line. A line that slopes up has a positive gradient A line that slopes down has a negative gradient.
y = x 5 4 3 2 1 -5 -4 -3 -2 -1 0 1 2 3 4 5 -1 -2 -3 -4 -5 y = 4x (1, 4) (0, 0) (-1, -4) x 4 x 4 x 4 Multiply x coordinate by 4 to get the y coordinate
y 5 4 3 2 1 -5 -4 -3 -2 -1 0 1 2 3 4 5 -1 -2 -3 -4 -5 (-2, 4) (-1, 2) (1, -2) x -2 x -2 x -2 Equation of line: y = -2x x Multiply the x-coordinate by 2 to get the y-coordinate
5 4 3 2 1 -5 -4 -3 -2 -1 0 1 2 3 4 5 -1 -2 -3 -4 -5 y = -4x - 4 y = -4x y = 2x y = 2x - 6
Monday 28th February Objectives: To be able to draw sloping lines from their equations. To be able to find intercepts and understand relative gradients.
y 5 4 3 2 1 x -5 -4 -3 -2 -1 0 1 2 3 4 5 -1 -2 -3 -4 -5 x = -2 y = x+2 y = x y = -x y + x = -2 y = 0 y = -3 x = 0 x = 2 x = 4
3. Work out 2x + 1 for each value of x For example, when X = -1, y = (2 x –1) + 1 You can draw sloping lines using a table of values. E.g. Draw the line with equation y = 2x + 1 1. Choose some values for x such as –3, -2, -1, 0, 1, 2, 3 2. Draw a table like this: -5 -3 -1 1 3 5 7 These are our coordinate pairs
5 4 3 2 1 -4 -3 -2 -1 0 1 2 3 -1 -2 -3 -4 -5 y = 2x + 1 • Choose some values for x • Draw a table for your values of x • Work out the y values using the equation • Plot the x and y coordinates • Join up the points to form a straight line • Label your line -5 -3 -1 1 3 5
5 4 3 2 1 The intercept of a line is the point ( 0, ) where the line crosses the y-axis. The number in the box is the value of y when x = 0. -3 -2 -1 1 2 3 0 -1 -2 -3 -4 -5 This grid shows the line with equation y = 2x + 2 The line crosses the y-axis at the point ( 0, 2 ) This point is called the intercept.
Example 2 9 5 Find the intercept of the line y = 5 - 3x 8 4 7 3 The intercept is the point (0 , ). Put x = 0 into the equation. The intercept is the point ( 0 , ). Put x = 0 into the equation 6 2 1 -4 -3 -2 -1 0 1 2 3 -1 -2 Example 1 Find the intercept of the line y = 4x + 5 y = 4 x 0 + 5 y = 0 + 5 = 5 y = 5 – 3 x 0 y = 5 – 0 = 5 The intercept is (0 , 5). The intercept is ( 0 , 5 ).
5 • (0 , 3) • (0 , -3) • (0 , 4) • (0 , 5) • (0 , -3) • (0 , -6) • (0 , 0) • (0 , 5) • (0 , 0) • (0 , 2) 4 3 2 1 -3 -2 -1 1 2 3 0 -1 -2 -3 -4 -5 What is the intercept? y = x + 2 y = x - 3 y = 2x y = 3x + 5 y = 4x - 6
Gradients Gradient is the mathematical word for steepness The bigger the gradient, the steeper the slope of a line. A line that slopes up has a positive gradient A line that slopes down has a negative gradient
-4 -3 -2 -1 1 2 3 4 0 Getting smaller Getting bigger Blue Blue Red Red Red Which line has the biggest gradient? Red or blue?
Using graphs Wednesday 2nd March Objective: To be able to read and interpret graphs.
What do graphs show? A graph shows a relationship on a coordinate grid. And across to the length axis a) When the mass is 0kg, the spring is 10cm long b) 19cm c) 1.5kg Read up from the mass axis Sam and Anna are testing a spring. This graph shows the relationship between the length of the spring and the mass hung on it. • Use the graph to find: • The length of the spring with no mass on it b) The length of the spring with a mass of 4.5kg c) The mass needed to make the spring 13cm long.
On the y-axis, 10 small squares is 50 units so 1 small square is On the x-axis, 10 small squares is 5 units so 1 small square is Using a scale Graphs often have different scales on each axis. The most common scales are: The factors of 10: 1, 2, 5, 10 The multiples of 10: 10, 20, 50, 100 You work out a scale like this: 50 ÷ 10 = 5 5 ÷ 10 = 0.5
Graphs in all 4 quadrants You can use this graph to convert temperatures between degrees Fahrenheit (0F) and degrees Celsius (0C) Use the graph to convert –500C into 0F You need to be able to use graphs in all four quadrants. Read down from –500C The answer is –600F And across to the vertical axis 300C = 1000F -100F = -260C 00C = 400F -700C = -550F 1600F = 600C
4 3 2 1 -3 -2 -1 -4 1 2 3 4 0 -1 -2 -3 -4 What can you tell me about… The blue line? Compared to the red line? The yellow line? The green line? Compared to the yellow line? The pink line?