Download
1 / 32
320 likes | 564 Views
Smart Energy & Consumer Behaviour. David Reiner and Musiliu Oseni EPRG , University of Cambridge Memorial Court, Clare College, CAMBRIDGE 16 MAY, 2014. Based on: M. Oseni , et al, 2013 EPRG Public Opinion Survey:

E N D
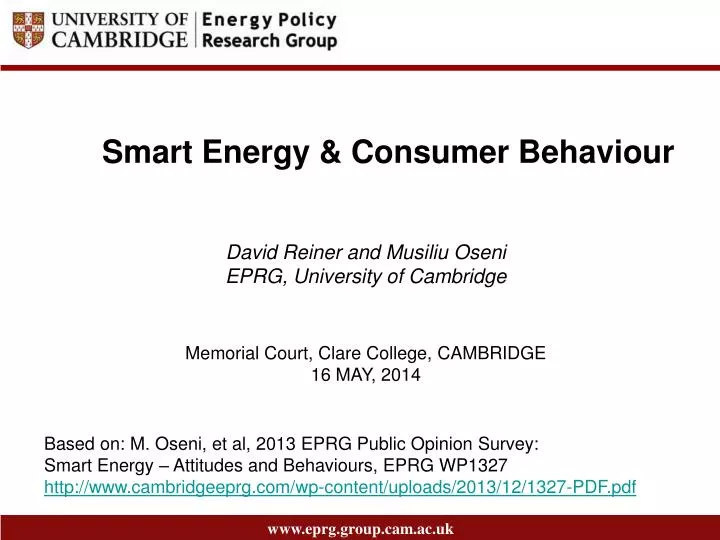
Smart Energy & Consumer Behaviour David Reiner and MusiliuOseni EPRG, University of Cambridge Memorial Court, Clare College, CAMBRIDGE 16 MAY, 2014 Based on: M. Oseni, et al, 2013 EPRG Public Opinion Survey: Smart Energy – Attitudes and Behaviours, EPRG WP1327 http://www.cambridgeeprg.com/wp-content/uploads/2013/12/1327-PDF.pdf
Outline • Background • Previous literature on smart metering and consumer behaviour • Some recent findings • EPRG Surveys to date • EPRG Survey 2013: “smart” energy – attitudes and behaviours • Meter readings and awareness of consumption • Billing and consumption behaviour • Concerns and new technology • Remote controlled appliances and WTP
Previous literature: smart devices & consumer behaviour • Smart devices need careful and customer group specific design • A one-size fits all approach cannot be justified • Accompanying education and information is crucial • People should be frequently informed about consumption & different options of receiving feedback • Impact of smart devices declines over time - habits are hard to break • Varying feedback and solutions like plug & play seem promising, but for effective design further research on habit formation and preference reversals is needed • Money savings provide strong incentives for behaviour change • Time varying prices in combination with smart meters increase demand response • Nudges (e.g. peer comparisons & goal setting) can have significant impact on consumer behaviour • Technologies like smart meters and network appliances which report energy use can make nudges more effective
Previous literature: smart devices & consumer behaviour • Thus far, most econometric studies have used treatment-control approaches to analyse the impact of smart meters on energy consumption. • Previous studies find significant impact of smart meters on energy consumption, but little econometric research on behavioural economic aspects e.g. peer effects. • Nudges • Easiest nudges to implement are information based (e.g. conservation advice) • Peer comparisons seem most effective • Also promising: product-integrated feedback & energy conservation goals • But again: heterogeneous effect implies that targeting households whose observable characteristics predict larger treatment effects could substantially improve cost effectiveness • Technologies like smart meters and network appliances which report energy use can make nudges more effective
EPRG Surveys to date Survey 2013 Survey 2010 Survey 2008 Survey 2006 Source: Department of Energy and Climate Change (DECC), 2013
EPRG Survey 2013: “smart” energy – attitudes & behaviours • Aim of the survey: • To gain insights into possible consumer response to smart meters and remote controlled appliances in particular • Focus: • meter readings and awareness of consumption • billing and consumption behaviour • payment type and frequency • remote controlled appliances and willingness to pay • concerns over technology • switching behaviour
EPRG Survey 2013: “smart” energy – attitudes & behaviours • 1526 respondents (representative sample of UK population) • 22.94% (i.e. 350 respondents) had an in-house monitor of some kind in their home • Source: EPRG Survey of UK Households, 2013 • prepayment meter with monitor (4.59%) • smart meter with monitor (3.5%) • only a monitor (14.8%)
EPRG Survey 2013: “smart” energy – attitudes & behaviours Monitor owners far more likely to read daily/weekly
EPRG Survey 2013: “smart” energy – attitudes & behaviours Many reduce frequency of checking since monitor first installed
EPRG Survey 2013: “smart” energy – attitudes & behaviours Smart phone apps have potential to induce behaviour change • 56% of respondents have a smart phone • 63% of smart phone owners state an app would help to become more aware of energy consumption
EPRG Survey 2013: “smart” energy – attitudes & behaviours Education, age, homeownership increases behaviour change
EPRG Survey 2013: “smart” energy – attitudes & behaviours Economic reasons drive willingness to change consumption Information provision: 40% of the respondents inform themselves online 11% state they consult their supplier 10% talk with friends 2% ask neighbours for information According to stated preferences, peer influences do not seem to matter much Smart technologies have played a minor role so far Remark: no significant gender difference! Peer pressures seem minor Remark: comparable result for switching behaviour
EPRG Survey 2013: “smart” energy – attitudes & behaviours Consumers claim their behaviour is independent of peer actions Further consideration of the role of peers Question: “Consider the following situation that might arise in a future electricity system with a large amount of renewable electricity sources (such as wind power). It is announced that in 3 days time, between 3pm and 8pm, there is a risk of power outages due to an expected combination of cold weather and low wind speeds. All domestic electricity consumers are asked to voluntarily reduce their electricity consumption during this period.” Would you? Significantlyreduce domestic consumption, but only if most of your peers did. 3% Significantlyreduce domestic consumption regardless of what your peers did. 31% Slightlyreduce domestic consumption , but only if most of your peers did. 4% Slightlyreduce domestic consumption regardless of what your peers did. 37% Not vary your consumption. 12% Increaseconsumption. 1% Don’t know 12% Again, consumers state that they to not condition their behaviour/decisions on their peers revealed preferences might look different, though!
EPRG Survey 2013: “smart” energy – attitudes & behaviours Technical & privacy concerns over remote controlled appliances • Concerns regarding new technologies: • 53% state concerns regarding remote controlled appliances • 24% are not sure • 22% have no concerns People are not afraid of behaviour change but rather of technical problems and lack of privacy • Remote controlled appliances must not affect availability & functionality ! • Privacy concerns must be taken seriously!
EPRG Survey 2013: “smart” energy – attitudes & behaviours Privacy concerns lower with age, homeowning, monitor, bill paymt
EPRG Survey 2013: “smart” energy – attitudes & behaviours Sensitivities over sharing of consumption data Majority of respondents want supplier to be the only body to access their data and over 1/5 want no one to access their data
EPRG Survey 2013: “smart” energy – attitudes & behaviours Concerns and New Technology
EPRG Survey 2013: “smart” energy – attitudes & behaviours Concerns and New Technology- Not want Data Recorded
EPRG Survey 2013: “smart” energy – attitudes & behaviours Interrupting Cold Appliances and WTA Load interruption of cold appliances (1-3 min per day) If your annual electricity bill was reduced by Xpounds per year, would you accept your cold appliances (e.g. fridges and freezers) being interrupted for short periods of 1-3 minutes over the course of the day? • Initial amount offered (10-50 pounds p.a.) was randomly drawn • Depending on whether agent accepted/didn’t accept, value decreased/increased by 10 GBP
EPRG Survey 2013: “smart” energy – attitudes & behaviours Interrupting Cold Appliances and WTA Load interruption of cold appliances (1-3 minutes per day) 1st round Based on the initial offer, overall 55% are willing to accept overall 55%
EPRG Survey 2013: “smart” energy – attitudes & behaviours Load interruption of cold appliances (1-3 minutes per day) by Value Offered Share of respondents that is willing to accept increases from 50 to 61% as value offered is increased 1st round 50% 53% 56% 61%
EPRG Survey 2013: “smart” energy – attitudes & behaviours Interrupting Cold Appliances and WTA Load interruption of cold appliances (1-3 min per day) 2nd round: overall among those whoaccepted, 65% accept a loweramount These are mainly those who had an initial value above 20 GBP. For highest initial offers acceptance rate is 80%! 2nd round Those who accepted 60% 42% 80% 71%
EPRG Survey 2013: “smart” energy – attitudes & behaviours Interrupting Cold Appliances and WTA Load interruption of cold appliances (1-3 min per day) 2nd round: overall, among those who did not accept the initial offer, 80% don’t accept in 2nd round either Independent of initial value, those who do not accept are likely to not accept higher values either. 2nd round Those who declined 81% 81% 77% 83%
EPRG Survey 2013: “smart” energy – attitudes & behaviours Load Shifting Wet Appliances and WTA Load shifting of wet appliances to preset time (9pm to 7am) If your annual electricity bill was reduced X pounds per year, would you accept having your wet appliances (e.g. dishwashers, washing machines, tumble dryer) preset so that they only operate between 9pm and 7am? • Initial amount offered (10-50 pounds p.a.) was randomly drawn • Depending on whether agent accepted/didn’t accept, value decreased/increased by 10 GBP
EPRG Survey 2013: “smart” energy – attitudes & behaviours Load Shifting Wet Appliances and WTA Load shifting of wet appliances to preset time (9pm to 7am) Only 37% are willing to accept 1st round overall 37%
EPRG Survey 2013: “smart” energy – attitudes & behaviours Load Shifting Wet Appliances and WTA Load shifting of wet appliances to preset time (9pm to 7am) Share of respondents that is willing to accept preset time stays relatively constant in value offered: between 37 and 40% 1st round by value offered 40% 37% 37% 39%
EPRG Survey 2013: “smart” energy – attitudes & behaviours Load Shifting Wet Appliances and WTA Load shifting of wet appliances to preset time (9pm to 7am) 2nd round: overall among those who accepted, 57% accept a lower amount. Counter intuitively, share decreases slightly with initial value to only 55%. 2nd round Those who accepted 60% 57% 55% 54%
EPRG Survey 2013: “smart” energy – attitudes & behaviours Load Shifting Wet Appliances and WTA Load shifting of wet appliances to preset time (9pm to 7am) 2nd round: overall, among those who did not accept, 89% don’t accept in 2nd round either Similar to case of load interruption, independent of initial value, those who do not accept, are likely to not accept higher savings either. 2nd round Those who declined 91% 86% 89% 88%
EPRG Survey 2013: “smart” energy – attitudes & behaviours Remote Controlled Appliances and WTA • Summary results remote control and willingness to accept: • Load interruption cold appliances and WTA: • Share of people who are willing to accept load interruption increases with the money offered as compensation. • Compensation of at least 10 pounds per annumrequired to accept. • Independent of initial value, those who do not accept load interruption initially, are likely to not accept either when offered a higher compensation. • Load shifting and WTA: • Share of respondents who accepts is lower than for load interruption • A decrease in the money value offered is more likely to lead to refusal. • Those who don’t accept initially, don’t accept higher value either. • Time based interruption of hot appliances and WTA: • People seem least willing to shift hot appliance use • Decrease in compensating value lowers acceptance rate more than other cases • Those who do not accept initially, also don’t accept higher compensation.
Summary • Smart devices have the potential tolead to behavioural response • Challenge is to sustain this behaviour change over time • Applications on smart phones are promising to raise awareness & induce behaviour change • Economic reasons are main driver of behaviour change • Smart energy technologies must be well designed/incentive compatible • Peer pressures were not perceived as strong • Remote controlled appliances must minimise impact on availability& functionality and privacy concerns must be taken seriously • Questions over whether the sorts of values that individuals are willing to accept can be justified by the benefits derived from the ability to have remote controlled appliances
References Allcott, H., 2009. "Social Norms and Energy Conservation," Working Papers 0914, Massachusetts Institute of Technology, Center for Energy and Environmental Policy Research. Costa, D., Kahn, M. E., 2010a. “Energy Conservation "Nudges" and Environmentalist Ideology: Evidence from a Randomized Residential Electricity Field Experiment”, NBER Working Paper 15939. Van Dam, S. S. , Bakker, C. A., van Hal, J. D. M., 2010. “Home energy monitors: impact over the medium-term”, Building Research & Information, 38: 5, 458 — 469. URL: http://www.tandfonline.com/openurl?genre=article&issn=0961-3218&volume=38&issue=5&spage=458 DiCosmo, V., Lyons, S., Nolan, A., 2012. "Estimating the impact of time-of-use pricing on Irish electricity demand," MPRA Paper 39971, University Library of Munich, Germany. Hargreaves, T., Nye, M., Burgess, J, Making energy visible, 2010. “A qualitative field study of how householders interact with feedback from smart energy monitors”, Energy Policy, Volume 38, Issue 10, October 2010, Pages 6111-6119, ISSN 0301-4215, 10.1016/j.enpol.2010.05.068. URL: http://www.sciencedirect.com/science/article/pii/S030142151000460X Karlan, D., EcoAlign Project Energy Code, 2010: “Nudges for Energy Conservation”, Project Energy Code, Issue No. 5, June 2010. URL: http://www.ecoalign.com/node/355 Krishnamurti, T., Schwartz, D., Davis, A., Fischhoff, B., de Bruin, W., Lave, L., Wang, J. , 2012. "Preparing for smart grid technologies: A behavioral decision research approach to understanding consumer expectations about smart meters," Energy Policy, Elsevier, vol. 41(C), pages 790-797. McCalley, L.T., 2006. "From motivation and cognition theories to everyday applications and back again: the case of product-integrated information and feedback," Energy Policy, Elsevier, vol. 34(2), pages 129-137, January. McCalley, L.T., Midden, C. J. H., 2002. “Energy conservation through product-integrated feedback: The roles of goal-setting and social orientation”, Journal of Economic Psychology, Volume 23, Issue 5, October 2002, Pages 589-603, ISSN 0167-4870, 10.1016/S0167-4870(02)00119-8. URL: http://www.sciencedirect.com/science/article/pii/S0167487002001198 Paetz, A.; Dütschke, E.; Fichtner, W., 2012. "Smart Homes as a Means to Sustainable Energy Consumption: A Study of Consumer Perceptions," Journal of Consumer Policy, Springer, vol. 35(1), pages 23-41, March. Schleich, Joachim & Klobasa, Marian & Brunner, Marc & Gölz, Sebastian & Götz, Konrad, 2011. "Smart metering in Germany and Austria: Results of providing feedback information in a field trial," Working Papers "Sustainability and Innovation" S6/2011, Fraunhofer Institute for Systems and Innovation Research (ISI). Vassileva, I., Wallin, F., Dahlquist, E., 2012. “Understanding energy consumption behavior for future demand response strategy development”, Energy, Volume 46, Issue 1, October 2012, Pages 94-100, ISSN 0360-5442, 10.1016/j.energy.2012.02.069


![Toru Yamamori [University of Cambridge]](https://cdn1.slideserve.com/3537992/slide1-dt.jpg)