
NES=3.49
Supplemental Figure 1. q<0.001. q<0.001. NES=3.49. NES=3.33. q<0.001. q<0.001. NES=3.37. NES=3.64. q<0.001. q<0.001. NES=3.49. NES=3.31. Supplemental Figure 2. AR Activity Score (compared to Control Vector). WT. Control Vector. F133L. F102C. F133V. Supplemental Figure 3.

NES=3.49
E N D
Presentation Transcript
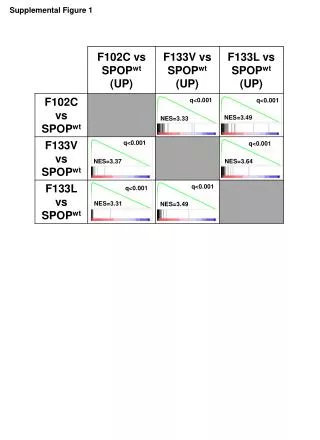
Supplemental Figure 1 q<0.001 q<0.001 NES=3.49 NES=3.33 q<0.001 q<0.001 NES=3.37 NES=3.64 q<0.001 q<0.001 NES=3.49 NES=3.31
Supplemental Figure 2 AR Activity Score (compared to Control Vector) WT Control Vector F133L F102C F133V
Supplemental Figure 3 Relative mRNA expression (compared to Control Vector)
Supplemental Figure 5 AR mRNA expression (compared to respective control)
Supplemental Figure 6 LNCaP A SPOP wt SPOP F102C SPOP F133V 0 50 500 0 50 500 0 50 500 ng/mL Dox AR 1.0 0.60 0.32 1.0 1.73 1.61 1.0 1.49 1.10 HA-SPOP β-Actin VCaP SPOP wt SPOP F102C B 0 50 500 0 50 500 ng/mL Dox AR 1.0 0.46 0.54 1.0 1.2 1.3 HA-SPOP β-Actin
SPOPwt AR + + + + + + - + + AR HA-SPOP Actin 293T HeLa HeLaSRC3-/- Input IgG Anti-Flag Input IgG Anti-Flag Input IgG Anti-Flag HA-SPOP 293T HeLa HeLaSRC3-/- Supplemental Figure 7 A B
Control vector ARv7 AR-FL (wt) AR ARv7 SPOP NH2 COOH Control vector ARwt ARA646D ARS648N ARS647F ARSTT648/649/650AAA ARwt Supplemental Figure 8 A Hinge Region PEST Sequence AR-full length (FL) AF1 DBD LBD/AF2 AF1 AF1 AF1 DBD DBD DBD LBD/AF2 LBD/AF2 LBD/AF2 646 650 646 650 646 650 646 650 A A A A S S S S S S S S T T T T T T T T A A A A S S S S S S S S T T T T T T T T SBC Motif A646D A646D A646D A646D AR-v7 S647F S647F S647F S647F NH2 DBD AF1 DBD DBD DBD S648N S648N AF1 AF1 AF1 COOH S648A/T649A/T650A S648A/T649A/T650A B Vector Flag-AR: Input (IB: Anti-Flag (AR)) IP: Anti-Flag (AR) IB: Anti-HA (SPOP) C Vector Flag-AR: Input (IB: Anti-Flag (AR)) IP: Anti-Flag (AR) IB: Anti-HA (SPOP)
Supplemental Figure 9 IP IB Input IgG SPOP A B siNT siSPOP-A siSPOP-B siSPOP-C siNT siSPOP-A siSPOP-B siSPOP-C LNCaP AR Abl AR AR SPOP Actin AR VCaP AR LAPC4 LNCAP Abl AR PC3 AR DU145 C D
Supplemental Figure 10 22Rv1 A 22Rv1 B
Supplemental Figure 11 10% FBS 10% CSS A B -37.0% -32.9% C -51.7% Absorbance (% of control vector) +2.4%
Supplemental Figure 12 A R=0.45 P<0.001 R=0.39 P<0.001 R=0.56 P<0.001 R=0.40 P<0.001 AR activity score 1 R=0.49 P<0.001 R=0.44 P<0.001 R=0.60 P<0.001 R=0.43 P<0.001 AR activity score 2 Combined SPOP mutation score SPOP F133V score SPOP F133L score SPOP F102C score Taylor et al, GSE21034 dataset (Primary cancer specimens) B R=0.50 P<0.001 R=0.45 P<0.001 R=0.56 P<0.001 R=0.59 P<0.001 AR activity score 1 AR activity score 2 R=0.54 P<0.001 R=0.47 P<0.001 R=0.53 P<0.001 R=0.66 P<0.001 Combined SPOP mutation score SPOP F133V score SPOP F133L score SPOP F102C score Grasso et al, GSE35988 dataset (Primary cancer specimens) C AR activity score 1 R=0.22 P<0.001 R=0.14 P<0.001 R=0.34 P<0.001 R=0.17 P<0.001 AR activity score 2 R=0.32 P<0.001 R=0.24 P<0.001 R=0.38 P<0.001 R=0.29 P<0.001 Combined SPOP mutation score SPOP F133V score SPOP F133L score SPOP F102C score TCGA dataset (Primary cancer specimens)