Download
1 / 15
150 likes | 216 Views
If x = ( x 1 , x 2 , … , x n ) represents a point in a subset A of R n , and f ( x ) is exactly one point in R m , then we say that f is a function from (a domain in) R n to R m . The function f is called a. scalar-valued function if m = 1.

E N D
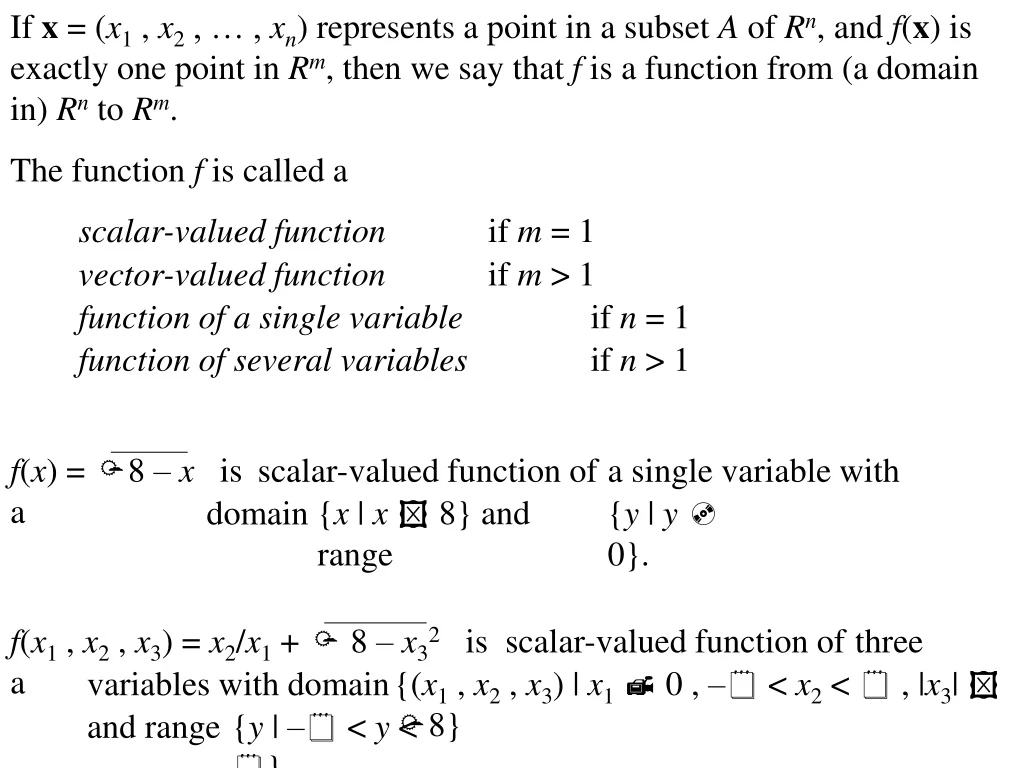
If x = (x1 , x2 , … , xn) represents a point in a subset A of Rn, and f(x) is exactly one point in Rm, then we say that f is a function from (a domain in) Rn to Rm. The function f is called a scalar-valued function if m = 1 vector-valued function if m > 1 function of a single variable if n = 1 function of several variables if n > 1 f(x) = 8 –x is a scalar-valued function of a single variable with domain {x | x 8} and range {y | y 0}. f(x1 , x2 , x3) = x2/x1 + 8 –x32 is a scalar-valued function of three variables with domain {(x1 , x2 , x3) | x1 0 , – < x2 < , |x3| 8} and range {y | – < y<}.
If x = (x1 , x2 , … , xn) represents a point in a subset A of Rn, and f(x) is exactly one point in Rm, then we say that f is a function from (a domain in) Rn to Rm. The function f is called a scalar-valued function if m = 1 vector-valued function if m > 1 function of a single variable if n = 1 function of several variables if n > 1 f(x) = (3|x| + 5 , x2) is a vector-valued function of a single variable with domain {x | – < x<} and range {(y1 , y2) | y1 5 , y2 0}. f(x1 , x2) = (x2/x1 , 8 –x12 , x1x2) is a vector-valued function of two variables with domain {(x1 , x2) | 0 < |x1| 8 , – < x2 < } and range {(y1 , y2 , y3) | – < y1< , 0 y2 < 8 , – < y3<}. Definition of the graph of a single-valued function (page 97) Definition of level curves and level surfaces (page 99)
Example 2 (page 98) z = f(x,y) = x + y + 2 y The level curves are x + y + 2 = c c = 0 c = 1 c = –1 c = 1 c = 0 c = –1 x x + y = – 2 x + y = – 1 x + y = – 3 This is the graph of a plane.
Example 2 (page 98) z = f(x,y)= x + y + 2 This is a plane. z = f(x,y) (0, 0, 2) (–2, 0, 0) y (0, –2, 0) x
z = f(x,y) = x – y + 2 This is a plane. z = f(x,y) (0, 0, 2) (–2, 0, 0) y (0, 2, 0) x
z = f(x,y) = 3x This is a plane. z = f(x,y) (1, 0, 3) y (–1, 0, –3) x
Example 3 (page 99) z = f(x,y) = x2 + y2 y The level curves are x2 + y2 = c c = 0 c = 1 c = –1 c = 2 c = 2 c = 1 c = 0 x x2 + y2 = 0 x2 + y2 = 1 x2 + y2 = –1 The level curve is empty. x2 + y2 = 2
Example 3 (page 99) z = f(x,y) = x2 + y2 Each level curve resulting from letting z be a constant c > 0 is Each level curve resulting from letting either x or y be a constant c is This is the graph of a circle of radius ccentered at the origin. a parabola. a circular paraboloid (pictured in Figure 2.1.7). Look at the Conic Sections Handout and the Quadric Surfaces Handout to see how various two-dimensional graphs and three-dimensional graphs can be identified.
Example 4 (page 100) z = f(x,y) = x2 – y2 y The level curves are x2–y2 = c c = 0 c = 1 c = –1 x x2–y2 = 0 x2–y2 = 1 c = 1 x2–y2 = –1 c = 0 c = –1 This is the graph of a hyperbolic paraboloid (pictured in Figure 2.1.10).
x2 + 4y2–z2 = – 4 Each level curve resulting from letting z be a constant c, where |c|>2, is an ellipse. Each level curve resulting from letting z be a constant c, where |c|=2, is a point. Each level curve resulting from letting z be a constant c, where |c|<2, is no points at all. Each level curve resulting from letting x be a constant c is Each level curve resulting from letting y be a constant c is a hyperbola. a hyperbola. This is the graph of a hyperboloid of two sheets.
x2/9 + y2/16 + z2 = 1 Each level curve resulting from letting z be a constant |c|<1 is an ellipse. Each level curve resulting from letting x be a constant |c|<3 is an ellipse. Each level curve resulting from letting y be a constant |c|<4 is an ellipse. This is the graph of an ellipsoid. x2 + y2 – z2 = 4 Each level curve resulting from letting z be a constant c is a circle. Each level curve resulting from letting x be a constant c is a hyperbola. Each level curve resulting from letting y be a constant c is a hyperbola. This is the graph of a hyperboloid of one sheet.
x2 + y2–z2 = 0 Each level curve resulting from letting z be a constant |c| > 0 is a circle. The level curve resulting from letting z be the constant 0 is the point (0 , 0). Each level curve resulting from letting x be a constant |c| > 0 is a hyperbola. The level curve resulting from letting x be the constant 0 is two straight perpendicular lines. Each level curve resulting from letting y be a constant |c| > 0 is a hyperbola. The level curve resulting from letting y be the constant 0 is two straight perpendicular lines. This is the graph of right cone.
z = – y2 In the yz plane, this graph is In R3, this graph (extended parallel to the x axis) is a parabola. a right parabolic cylinder. x2 + y2 = 25 In the xy plane, this graph is In R3, this graph (extended parallel to the z axis) is a circle (of radius 5 centered at the origin). a right circular cylinder. z = x2 + y2 – 4x – 6y + 13 = (x – 2)2 + (y – 3)2 Each level curve resulting from letting z be a constant c > 0 is a circle (of radius c entered at (2,3)). This is the graph of a shifted circular paraboloid.
Describe each graph in R3. x2 + 3y2 + z2 = 11 x2 + 3y2 + z2 = 0 z2 = 0 x2 + y2 = 9 x2 + y2 = 0 x2 + y2 + z2 = 10 x2 + y2 + z2 + 1 = 0 x2 – y2 = 0 ellipsoid the single point (0 , 0 , 0) the xy plane a circular cylinder of radius 3centered at the origin the line which is the z axis a sphere of radius 10centered at the origin no points at all two planes (x + y = 0 and x – y = 0 ) Level curves help us picture graphs in R3. It is impossible to picture graphs in Rn for n > 3, but level surfaces can be used to give some insight into graphs in R4.
Look at each of the following: Example 5 (page 102) w = f(x,y,z) = x2 + y2 + z2 Example 6 (page 103) w = f(x,y,z) = x2 + y2 –z2


