Download
1 / 18
180 likes | 201 Views
Learn about internet measurement, active & passive tools, workload generation, and measurement characteristics in CS 640 course outline. Understand essential concepts for analyzing network performance.

E N D
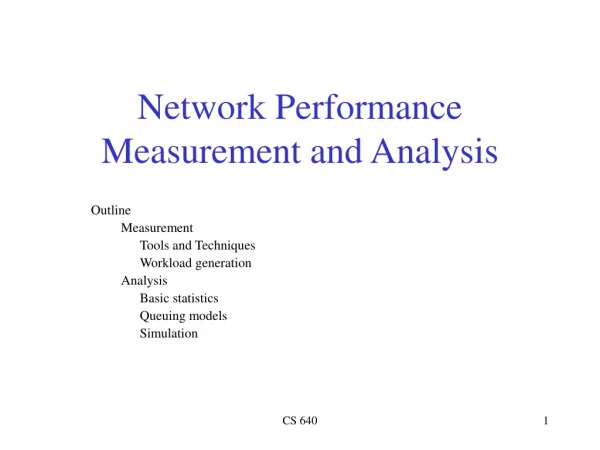
Network Performance Measurement and Analysis Outline Quiz #1 solutions Measurement Tools and Techniques Workload generation Analysis Basic statistics Queuing models Simulation Homework #2 posted by end of the day CS 640
Quiz #1 Solutions • Show how RSA can be used for two way authentication. • Briefly explain (3 or 4 sentences max) the pros and cons of persistent connections in HTTP/1.1 Solution: Pro: reduces network traffic, Con: can increase server load • Applications • What is a basic difference between SMTP and other application level protocols? Solution: SMTP is not an interactive protocol. • What was the motivation for Nagle’s algorithm (hint think about the telnet application)? Solution: telnet generates “tinygrams” – lots of very small packets. Nagle sends groups of data based on ACK process. CS 640
Measurement and Analysis Overview • Size, complexity and diversity of the Internet makes it very difficult to understand cause-effect relationships • Measurement is necessary for understanding current system behavior and how new systems will behave • How, when, where, what do we measure? • Measurement is meaningless without careful analysis • Analysis of data gathered from networks is quite different from work done in other disciplines • Measurement/analysis enables models to be built which can be used to effectively develop and evaluate new techniques • Statistical models • Queuing models • Simulation models CS 640
Determining What to Measure • Before any measurements can take place one must determine what to measure • There are many commonly used network performance characteristics • Latency • Throughput • Response time • Arrival rate • Utilization • Bandwidth • Loss • Routing • Reliability CS 640
Measurement Introduction • Internet measurement is done to either analyze/characterize network phenomena or to test new tools, protocols, systems, etc. • Measuring Internet performance is easier said than done • What does “performance” mean? • Workload (what and where you’re measuring) selection is critical • Reproducibility is often essential • Many tools have been developed to measure/monitor general characteristics of network performance • traceroute and ping are two of the most popular • These are examples of active measurement tools • Passive tools are the other major category • Representative and reproducible workload generation will be a focus CS 640
Active Measurement Tools • Send probe packet(s) into the network and measure a response • Ping: RTT and loss • Zing: one way Poisson probes • Traceroute: path and RTT • Nettimer (Lai): latest bottleneck bandwidth using packet pair method • Pathchar: per-hop bandwidth, latency, loss measurement • Pchar, clink: open-source reimplementation of pathchar • Problem: measurement timescales vary widely Tn+1 - Tn = max(S/BW, T1 – T0) Size/BW T1 T0 Tn+1 Tn CS 640
Passive Measurement Tools • Passive tools: Capture data as it passes by • Logging at application level • Packet capture applications (tcpdump) uses packet capture filter (bpf,libpcap) • Requires access to the wire • Can have many problems (adds, deletes, reordering) • Flow-based measurement tools • SNMP tools • Routing looking glass sites • Problems • LOTS of data! • Privacy issues • Getting packet scoped in backbone of the network CS 640
Workload Generation • Local and/or wide area experiments often require representative and reproducible workloads • How do we select a workload? • Currently HTTP makes up the majority of Internet traffic • Trace-based workloads • Capture traces and replay them • Black-box method • Synthetic workloads • Abstraction of actual operation • May not capture all aspects of workload • Analytic workloads • Attempt to model workload precisely • Very difficult CS 640
SURGE Web Workload Generator • Scalable URl Generator • Analytic workload generator • Based on 12 empirically derived distributions of Web browsing behaviror • Explicit, parameterized models • Captures “heavy-tailed” (highly variable) properties of Web workloads • Widely used • SURGE components: • Statistical distribution generator • Hyper Text Transfer Protocol (HTTP) request generator CS 640
Workload characteristics captured in SURGE BF EF1 EF2 Off time SF Off time BF EF1 Characteristic Component Model System Impact File Size Base file - body Lognormal File System * Base file - tail Pareto * Embedded file Lognormal * Single file1 Lognormal * Single file 2 Lognormal * Request Size Body Lognormal Network * Tail Pareto * Document Popularity Zipf Caches, buffers Temporal Locality Lognormal Caches, buffers OFF Times Pareto * Embedded References Pareto ON Times * Session Lengths Inverse Gaussian Connection times CS 640
SURGE Architecture SURGE Client System ON/OFF Thread ON/OFF Thread LAN Web Server System ON/OFF Thread SURGE Client System SURGE Client System CS 640
SURGE and SPECWeb96 exercise servers very differently Surge SPECWeb96 CS 640
Analyzing Measured Data • Analyzing measured data in networks is typically done using statistical methods • Selecting appropriate analysis method(s) is critical • Averaging • Dispersion (variability) • Correlations • Regression analysis • Distributional analysis • Frequency analysis • Principal-component analysis • Cluster analysis • Each form of analysis has strengths and weaknesses CS 640
Self-Similar Nature of Network Traffric • W. Leland, M. Taqqu, W. Willinger, D. Wilson, On the Self-Similar Nature of Ethernet Traffic, IEEE/ACM TON, 1994. • Baker Award winner • V. Paxson, S. Floyd, Wide-Area Traffic: The Failure of Poisson Modeling, IEEE/ACM TON, 1995. • M. Crovella, A. Bestavros, Self-Similarity in World Wide Web Traffic: Evidence and Possible Causes, IEEE/ACM TON, 1997. CS 640
Queuing Models • One of the key modeling techniques for computer systems in general • Vast literature on queuing theory • Nicely suited for network analysis • Prof. Mary Vernon is our local expert • Generally, queuing systems deal with a situation where jobs (of which there are many) wait in line for a resource (of which there are few) • Queuing theory can enable us to determine response time • Examples? CS 640
Queuing Models contd. • Example: packets arriving at a router – how can we determine how long it takes for packets to be forwarded by the router? • Characteristics necessary to specify a queuing system • Arrival process • Service time distribution • Number of servers • System capacity (number of buffers) • Population size • Service discipline • Kendal notation: A/S/m/B/K/SD • Response time = waiting time + service time • For stability, mean arrival rate must be less than mean service rate CS 640
Little’s Law • One of the most basic theorems in queuing theory (1961) • Mean number jobs in system = arrival rate * mean response time • Treats a system as a black box • Applies whenever number of jobs entering the system equals number of jobs leaving the system • No jobs created or lost inside system • Can be extended to include systems with finite buffers • Example: Average forwarding time in a router is 100 microseconds, I/O rate for packets is 100k. What is the mean number of packets buffered in the router? CS 640
Simulation Models • Simulation is one of the most common/important methods of analysis/modeling • Typically an abstraction of the system under consideration • Can provide significant insight to system’s behavior • Network simulation is difficult because of the different layers of operation and the complexity at each layer • Simulation options: build your own, use someone else’s • Canonical network simulator is ns developed at LBL • www.isi.edu/nsnam/ns • ssf-net is a new, routing-enabled simulator CS 640