Download
1 / 68
680 likes | 706 Views
Beyond ROI: Making the Business Case for Worksite Health Promotion. George J. Pfeiffer President The WorkCare Group, Inc. P.O. Box 2053 Charlottesville, VA 22902 (434) 977-7525 georgeworkcare@ earthlink.net IAWHP Executive Summit, April 7, 2010. Critters. What Are We Going to Cover?.

E N D
Beyond ROI:Making the Business Case for Worksite Health Promotion George J. Pfeiffer President The WorkCare Group, Inc. P.O. Box 2053 Charlottesville, VA 22902 (434) 977-7525 georgeworkcare@ earthlink.net IAWHP Executive Summit, April 7, 2010
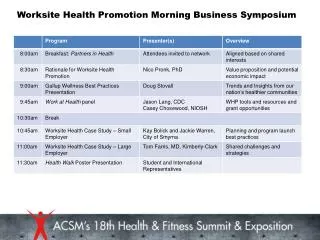
What Are We Going to Cover? • Review the evolution of worksite health promotion • Does it make a difference? • Refocusing health promotion • Addressing your entire population • Common strategies • Promising practices
First… In the beginning…
The Ongoing Proposition…. “A healthy employee saves the organization money and is more productive.”
In the Beginning…. • A variety of employee support services: • Occupational health and safety • Recreation • Travel • Employee Assistance Programs • Executive Fitness Programs
Executive Fitness Programs1968… • Exclusive • Medical department • Clinical— “The Executive Heart Attack” • Cardiovascular risk reduction focus • “Exercise prescription”
Employee Fitness Programs-1976… • Inclusive-major locations • Cardiovascular focus • Running boom: “Jim Fix Effect” • Expansion of recreation services or facility management
Employee Health Management Programs-1980…Phase I • Hey! Our costs are rising! • Inclusive-all employees, and some households • Introduction of the Health Risk Appraisal (HRA) • Risk reduction focus • Health fairs/onsite programming • Medical self-care • Communication programs
Employee Health Management Programs-1986…Phase II • Hospitals and MCOs become vendors to employers • Onsite screenings • “Health management centers” versus “fitness centers” • Computer learning • Telephonic nurse-line, EAP • Greater focus on high-utilizers
Employee Health Management Programs-1996…Phase III • Rise of the Internet (virtual programming) • Greater integration of services • Greater use of third-party vendors • Concept of presenteeism • Concept of risk migration and cost
Employee Health Management Programs-Today…Phase IV • Population management • Integrated data management/HPM • Predictive modeling • Disease management • Health coaching • Targeted and tailored messaging (social marketing) • Value-based benefit design • Incentives • Culture of Health
R.O.I./Where’s the Beef? From a review of 73 published studies of WHP programs1 • Average $3.50-to-$1 savings-to-cost ratio in reduced absenteeism and health care costs. From a review of 56 published studies of WHP programs2 • Average 27% reduction in sick leave absenteeism • Average 26% reduction in health costs • Average 32% reduction in workers’ comp. & disability mgmt. claims costs • Average $5.81-to-$1 savings-to-cost ratio A comprehensive health management program at Citibank3 • $4.56-$4.73-to-$1 savings-to-cost ratio in reduced total health care costs 1. Aldana SG. 2.. Chapman LS. 3. . Ozminkowski RJ, Dunn RL, Goetzel RZ, Cantor RI, Murnane J, Harrison M.
So…what does this all mean? “There’s a body of work that demonstrates the efficacy of worksite health management programs.”
So…what does this all mean? Let’s move beyond the debate regarding health promotion’s role in reducing direct healthcare costs. Let’s move to productivity management. It’s all about WORK!
What’s Wrong With... WORK?
Max Weber “One does not work to live; one lives to work.”
Our Work Can Provide: Well-being Opportunity Reward Know-how
What Drives Competitive Advantage? • Innovative products/services • Market share • Shareholder value • Positive R.O.I. • Revenue/Profitability • Value of human capital
What’s a Productive Employee? • Competence (“know-how”) • Results-oriented • Quality focus • Team-oriented • Fully-engaged (“present”) • Physically and mentally well
Key Observations ONE: Employee health directly affects an organization’s bottom-line.
Runaway Health Care Costs Year Annual Cost GDP 2003 $6,020 14.9% 2004 $6,880 14.3% 2009 $8,160 17.6% 2018 $13,310 20.3% Employer Health Care Strategy Survey 2003, Delotte & Touche
The Problem: Rising Medical Costs/Eroding Profit • Source:The National Data Book: 2001 IRS Data Reports
Key Observations TWO: Direct health care costs are the “tip of the iceberg.”
Direct Costs Related to Indirect *$6,000 Per EmployeeDirect Medical Costs Estimated $12,000 per EmployeeMedically Related Productivity Costs Estimated Total Costs $18,000 PEPY Sources:Loeppke, et.al., JOEM, 2003; 45:349-359 and Brady, et.al., JOEM, 1997; 39:224-231
Being “There” or “Here”?Presenteeism • Chronic disease (e.g, depression, diabetes) • Acute conditions (e.g., allergies, U.R.T.I.) • Work issues (e.g., management style, change) • Personal issues (e.g., care-giving, financial)
We Can’t Ignore Direct Costs, Yet, We Need to Focus More on… • Absenteeism • Presenteeism The costs of absenteeism and presenteeism may be three times your direct health-related costs.
Key Observations THREE: A “perfect storm” is brewing that will further impact the affect of employee health and health care delivery on organizational performance and competitiveness.
“A Perfect Storm?” • High health care costs with questionable quality • Aging workforce • Rise of chronic health conditions • Low consumer accountability • Global economy/competition
High Costs/Questionable Quality • U.S. is near bottom of Western countries regarding healthcare measures, but pays the most. • Participants received only 54.9% of recommended care. • Majority of chronic conditions were underused regarding care. • Deficits pose serious threats to the health and well-being of Americans. Sourse: McGlynn, E.A., Asch, S.M., Adams. J. et.al. The quality of health care deleivered to adults in the United States. N Engl J Med 348;26, 2003
Aging Workforce/Chronic Conditions • The median age of workers in 1988 was 35.9, and in 2008 was 40.7 • In many “mature” industries the average age is 48 years and above. • 125 million Americans had chronic ailments in 2000 ($510 B) • 78% of costs attributed to chronic conditions 1. Bureau of Labor Statistics:http//bls.gov/opub/ted/2001/june/wk4/art02.htm 2. Partnership for Solutions. Projection of chronic illness prevalence and cost inflation. Johns Hopkins University and Robert Wood Johnson Foundation, 2001; http://www.partnershipforsolutions.org/statistics/direct_costs.htm
Low Consumer Accountability • Entitlement mentality • Traditionally distanced from true cost of health care (CDHP) • Low commitment to self-care • Lacks appropriate decision-making skills • Low compliance to treatment regimen
Economic Uncertainty • Global competition • High unemployment • High overhead costs • Eroding profit margins
Key Observations FOUR: Health management needs to not only focus on disease management, but on primary prevention and risk reduction.
Why? In order to stay competitive, we cannot ignore the impact that employee health has on organizational effectiveness. To begin, we need to understand that our population’s health risks can be a predictor of business performance.
Understanding Your Risks • Within a population, the distribution of medical costs is always the same • Approximately 60 percent of a working population is categorized as low risk (e.g., market share) • At any given time, there is a migration (“churn”) of employees between risk categories Source: University of Michigan Health Management Research Center.. The Ultimate 20th Century Cost Benefit Analysis and Report. March 2000; 1-12
Understanding Your Risks • Health risks and medical care costs increase and decrease independent of interventions (e.g., natural flow of a population) • Identify the “natural flow” of a defined population–benchmark against this cohort • Move population to low cost or low risk Source: University of Michigan Health Management Research Center.. The Ultimate 20th Century Cost Benefit Analysis and Report. March 2000; 1-12
Understanding Your Risks Health risks follows costs: • Direct medical costs • Tests/procedures • Out-patient • In-patient • Pharmaceuticals • Indirect costs • Absenteeism (STD/LTD, sick days) • Presenteeism
Group Your Risks, Move Your Population Risks: Categories 0-2 Low 3-4 Medium 5+ High HPM research shows a direct relationship between health risks and direct and indirect costs. Source: University of Michigan Health Management Research Center.. The Ultimate 20th Century Cost Benefit Analysis and Report. March 2000; 1-12
Don’t Ignore Your Healthy! Improve Your “Market Share” • Keep healthy people healthy • $350 is saved when a low-risk employee remains low-risk • Target high risk populations • $153 is saved when a high-risk employee’s health risks are reduced Source: University of Michigan Health Management Research Center.. The Ultimate 20th Century Cost Benefit Analysis and Report. March 2000; 1-12
No Engagement, No Effectiveness • 80%-85% low risk • 90% total participation within three years • Health Risk Appraisal • Health Coaching • Two other programs
So…What’s Health Management to Your Organization? • Cost-driver? • Performance driver?
St. Paul’s American Workers Under Pressure , 1992 “Successfully managing human risks requires organizations to pay attention to the whole employee, both on and off the job.”
The M.E. Factors Meaningful Employment is a product of: Meaningful Engagement + Meaningful Environment
Shifting the Discussion We need to question the value of our health promotion initiatives: Cost Effectiveness? versus Life Effectiveness?
The Bottom Line… • Though we need to focus on the “hard factors” (e.g., products, markets, margins) of the business… • We cannot ignore the “soft factors” that truly sustain a business…