Download
1 / 47
470 likes | 548 Views
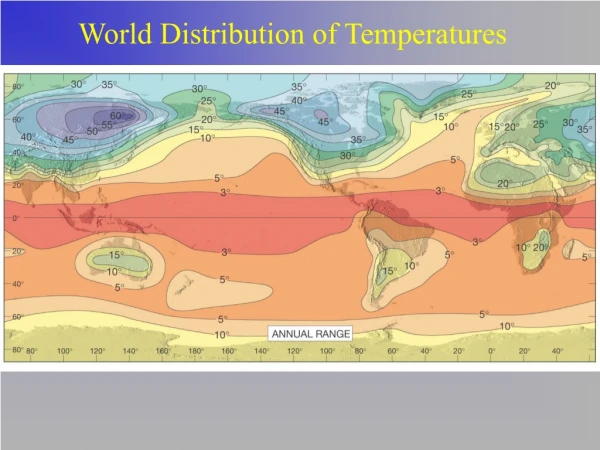
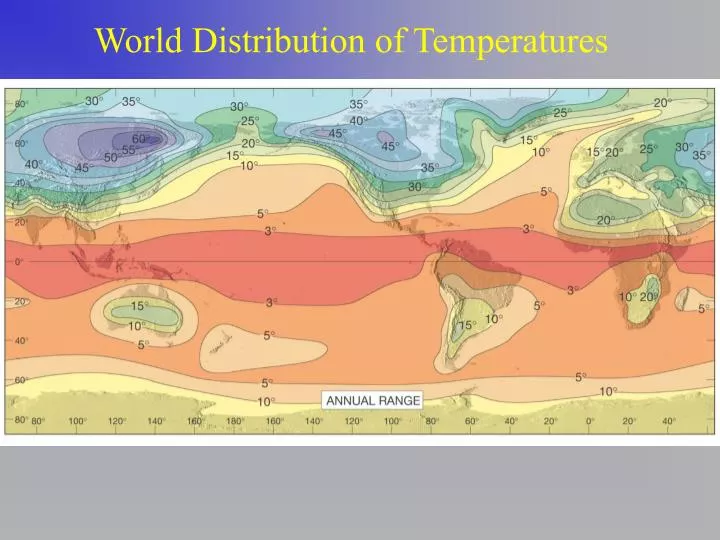
World Distribution of Temperatures. Air Temperature Data: what data are recorded?. Daily Mean Daily Range. Monthly Mean. Annual Mean Annual Range. Controls of Temperature. Latitude. Sun Angles at Different Latitudes. Geographic Position. Coasts. Temperature control Land and Water.

E N D
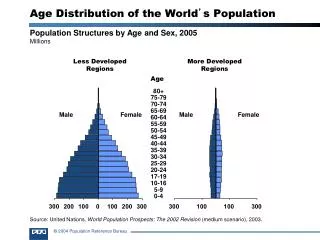
Air Temperature Data: what data are recorded? Daily Mean Daily Range Monthly Mean Annual Mean Annual Range
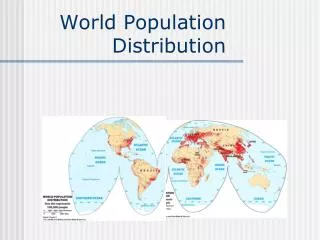
Controls of Temperature Latitude
Temperature controlLand and Water • Continental climates • Land water heating • Mobility • Transparency • Evaporation • Specific heat
Inverewe Gardens.”..This colourful sub-tropical garden owned by the National Trust for Scotland is located further north than Moscow, but thanks to the North Atlantic Drift, all kinds of exotic plants grow here in 50 acres... Highly recommended.”http://www.scotland-inverness.co.uk/gardens.htm
57.5 degrees North (same latitude as Moscow and Hudson’s Bay… semi-tropical gardens on the coast of Scotland
Note the influence of clouds… which interrupts the latitudinal patterns
Temperature Measurement Thermometer
Temperature Inversion… warmer air slides over the cool air at the surface trapping the surface air beneath a very stable upper air mass
Degree Days • Heating Degree Days • Growing Degree Days • Cooling Degree Days An index of temperature that can be used to assess climatic conditions.
Growing Degree DayBase temperatures (TBase) • 40F - wheat, barley, rye, oats, flaxseed, lettuce, asparagus • 45F - sunflower, potato • 50F - sweet corn, corn, sorghum, rice, soybeans, tomato • 44F - corn rootworm • 48F - alfalfa weevil • 50F - black cutworm, European corn borer
Calculating GDD • first find the mean temperature for the day. (This is usually done by taking the high and low temperature for the day, adding them together and dividing by two.) • If the mean temperature is above Tbase, then the growing degree day amount equals the mean temperature minus Tbase • For example, if the mean temperature was 75F then the growing degree day amount equals 25, using a Tbase = 50F • http://www.sws.uiuc.edu/atmos/statecli/FAQ/degree_days.htm
An Example of GDD requirements: • Field Corn Hybrid Maturity Classification. • Maturity Days GDD • Early-season 85-100 2100-2400 • Mid-season 101-130 2400-2800 • Full-season 131-145 2900-3200 • http://www.ces.purdue.edu/extmedia/NCH/NCH-40.html