Download

1 / 26
260 likes | 494 Views
What’s the Difference? Analysing the relative performance of Impact Metrics. David Tarrant davetaz@ecs.soton.ac.uk Electronics and Computer Science. Overview. Bibliometrics Why Impact Metrics Publishing Paradigms Metrics Comparison Bibliometrics as an aid . Citation Analysis.

E N D
What’s the Difference?Analysing the relative performance of Impact Metrics David Tarrant davetaz@ecs.soton.ac.uk Electronics and Computer Science
Overview • Bibliometrics • Why Impact Metrics • Publishing Paradigms • Metrics Comparison • Bibliometrics as an aid
Citation Analysis “Citation analysis is the examination of the frequency, patterns and graphs of citations in articles and books.” Impact Factor Article Impact Factor REF Impact Factor? PageRank Citation Count
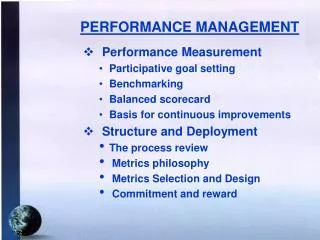
Why use Impact Metrics? Funding Bodies Institutions Libraries Researchers REF Performance Serials Crisis Research Quality Publishing Practices Publication Impact
Why/Where Researchers Publish? Build Networks Enhance Science Cost Metrics Gain Citations Time Constraints Effort Target Audience Job Safety Promotion Opportunities Publish or Perish?
Metrics (1)Citation Count • Total number of citations towards an item 4
Metrics (2)(Journal) Impact Factor No of citations in year X to articles published in year X - 1 & year X – 2 Total number of citable articles from year X - 1 & year X - 2 • Average No. of times an article published in the last 2 years has been cited this year
Metrics (3)Eigenfactor (EF) The EF of a citing Journal Number of Citations in Journal Σ EF(journal) • Weighted citations, like a weighted impact factor. Also takes into account reader time.
Metrics (4)Article Influence Score Journals Eigenfactor Score Fraction of Articles Published by Journal • Designed to measure the relative importance of a JOURNAL on a per article basis. Not an indicator of article influence.
Similarity in ISI Metrics - JCR 2008 -1 = Complete Inverse Correlation 0 = No Relation 1 = Complete Correlation
“15% of articles, account for 50% of the citations, and the most cited 50% of the papers account for 90% of the citations” P.O. Seglen. Why the impact factor of journals should not be used for evaluating research. British medical journal, 314(7079):497, 1997.
Metrics (5)REF Pilot Metric If a Journal is in a subject area, then the REF denominator is essentially the total Journal Impact Factor for all journals in an area for one year only Can still suffer from the long tail effect. Centile distribution would help alleviate this. No. of citations to article A Average no. of citations to similar articles published in the same year
Social Science • The study of citations is a social science • Whenever you measure something, you are measuring human behavior. • You have to be very careful with how you view the outputs of such a study. • If you can find the typical behavior you may be able to use a metric to represent it.
Social Science - Article Interest • Might solve a highly complex problem which only 9 others understand • Might open up new science but won’t be the primary cited article if another gives a usage, or reviews it. • 1/3rd of citations are copied verbatim (arXiv)
Digital Repositories • 900+ OA Repositories • 18 Million Records • In Pilot Study 73% of Institutions have an IR registered with ROAR • 46% could have sourced all their data from the repository.
Digital Repositories • Telling your own story • Find out research directions • Who are the big collaborations • More evidence for the expert panel
More on metrics • Bibliometrics gets a much wider use than simply publications, depending on what you call it: L. Bjorneborn and P. Ingwersen. Toward a basic framework for webometrics. Journal of the American Society for Information Science and Technology, 55(14), 2004.
Metrics (6)PageRank PR = PageRank L = Number of Links n = Our Node p = Citing Nodes α = Dampning Factor (Random Surfer) Offers a weighted citation to help prevent against false positives. More applicable when there is no peer review.
More Correlations (AIF) • Correlation of Rank Order • Based upon data obtained from citebase.org * T. Brody and S. Harnad. Earlier web usage statistics as predictors of later citation impact. Journal of the American Society for Information Science and Technology, 57 (8):1060-1072, 2006.
Metrics Similarity J. Bollen, H. Van de Sompel and M. A. Rodriguez. ,Towards usage-based impact metrics: first results from the MESUR project.
Complimentary Bibliometric Methods • Bibliographic Coupling • The idea of being able to relate things via links • e.g. A Paper’s field can be determined: • From the authors departmental affiliation. • From that papers citations. • From that papers usage. • From which papers it is most often co-cited with. • The last point is the only one related to impact
Finding Connections • Usage Data • Citation Data J. Bollen. et al. Clickstream data yields high-resolution maps of science. PLoS One, February 2009. Featured in Butler, D. Nature News, 9 March; 2009. doi:10.1038/458135a.
Co-Citations • A bridge paper can be found if it is Co-Cited with Publications in many disparate areas. • What I want to know is can you use these Co-Citations as an indicator of Impact?
Summary • Advise on Human Behavior • Many metrics tell you different things • Important to match the best metric to your study • Examine the landscape
Summary (2) • Researcher & The Institution • Gathering Data • More usage of metrics • Building your institutional story • Discover new research collaborations • Early indicators
David Tarrant davetaz@ecs.soton.ac.uk Electronics and Computer Science ?