
ParInfo1
Child ZAP – parent Scales n=629 Chi-Square = 920.803 (282 df; p=.000) CFI = .961 TLI = .953 RMSEA = .042 (95% CI = .039 - .046 SMR = 0.0380 Standardized estimates. .60. ParInfo1. e1 . .77. .60. ParInfo2. e2. .78. .72. .85. ParInfo3. e3. ParInfo. .83. .68. ParInfo4. e4 .

ParInfo1
E N D
Presentation Transcript
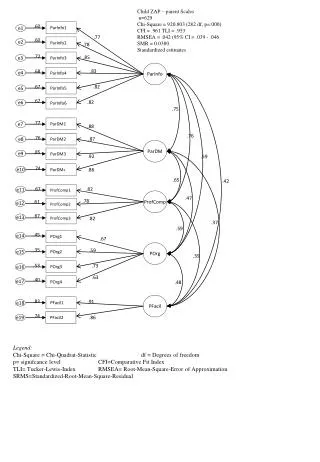
Child ZAP – parent Scales n=629 Chi-Square = 920.803 (282 df; p=.000) CFI = .961 TLI = .953 RMSEA = .042 (95% CI = .039 - .046 SMR = 0.0380 Standardized estimates .60 ParInfo1 e1 .77 .60 ParInfo2 e2 .78 .72 .85 ParInfo3 e3 ParInfo .83 .68 ParInfo4 e4 .67 .82 ParInfo5 e5 .67 .82 ParInfo6 e6 .75 .77 ParDM1 e7 .88 .76 .76 ParDM2 .87 e8 ParDM .85 ParDM3 e9 .92 .59 .74 ParDM4 .86 e10 .65 .42 .67 .82 ProfComp1 e11 ProfComp .47 .78 .61 ProfComp2 e12 .67 ProfComp3 .82 e13 .37 .59 .45 POrg1 e14 .67 POrg .35 .59 POrg2 e15 .39 .53 .73 POrg3 e16 .63 .40 POrg4 .48 e17 PFacil .83 .91 PFacil1 e18 .74 PFacil2 .86 e19 Legend: Chi-Square = Chi-Quadrat-Statistic df = Degrees of freedom p= signifcance level CFI=Comparative Fit Index TLI= Tucker-Lewis-Index RMSEA= Root-Mean-Square-Error of Approximation SRMS=Standardized-Root-Mean-Square-Residual