Using Random Forests to explore a complex Metabolomic data set
Using Random Forests to explore a complex Metabolomic data set. Susan Simmons Department of Mathematics and Statistics University of North Carolina Wilmington. Collaborators. Dr. David Banks (Duke) Dr. Jacqueline Hughes-Oliver (NC State) Dr. Stan Young (NISS) Dr. Young Truoung (UNC)

Using Random Forests to explore a complex Metabolomic data set
E N D
Presentation Transcript
Using Random Forests to explore a complex Metabolomic data set Susan Simmons Department of Mathematics and Statistics University of North Carolina Wilmington
Collaborators • Dr. David Banks (Duke) • Dr. Jacqueline Hughes-Oliver (NC State) • Dr. Stan Young (NISS) • Dr. Young Truoung (UNC) • Dr. Chris Beecher (Metabolon) • Dr. Xiaodong Lin (SAMSI)
Large data sets • Examples • Walmart • 20 million transactions daily • AT&T • 100 million customers and carries 200 million calls a day on its long-distance network • Mobil Oil • over 100 terabytes of data with oil exploration • Human genome • Gigabytes of data • IRA
Dimensionality • 3,000 metabolites • 40,000 genes • 100,000 chemicals • Try to find the signal in these data sets (and not the noise)…..Data mining • Examples of data mining techniques: pattern recognition, expert systems, genetic algorithms, neural networks, random forests
Today’s talk • Focus on classification (supervised learning…use a response to guide the learning process) • Response is categorical (Each observation belongs to a “class”) • Interested in relationship between variables and the response • Short, fat data (instead of long, skinny data)
Short, fat data n<p problem
Random Forests • Developed by Leo Breiman (Berkeley) and Adele Cutler (Utah State) • Can handle the n<p problem • Random forests are comparable in accuracy to support vector machines • Random forests are a combination of tree predictors
Tree for previous data set All observations N=8 Height < 66 N=4 Height > 66 N=4 Male N=0 Female N=4 Male N=3 Female N=1
Random Forest • First, the number of trees to be grown must be specified. • Also, the number of variables randomly selected at each node must be specified (m). • Each tree is constructed in the following manner: 1. At each node, randomly select m variables to split on.
Random Forest • The node is split using the best split among the selected variables. • This process is continued until each node has only one observation, or all the observations belong to the same class. • Do this for each tree in the “forest”
N=70 (40 G, 30K) Calories <100 (2 G, 15 K) Calories <100 (38 G, 15 K) Fat <1 15 K Fat >1 2 G Carbo<12 15 K Carbo>12 38G
Random Forest • Another important feature is that each tree is created using a bootstrap sample of the learning set. • Each bootstrap sample contains approximately 2/3 of the data (thus approximately 1/3 is left) • Now, we can use the trees built not containing observations to get an idea of the error rate (each tree will “vote” on which class the observation belongs to). • Example
N=70 (40 G, 30K) Calories <100 (2 G, 15 K) Calories <100 (38 G, 15 K) Fat <1 15 K Fat >1 2 G Carbo<12 15 K Carbo>12 38G Observation withheld from creating this tree Calories Fat Carbo Mfr 98 2 10 K
Random Forest • This gives us an “out of bag” error rate • Random forests also give us an idea of which variables are important for classifying individuals. • Also gives information about outliers
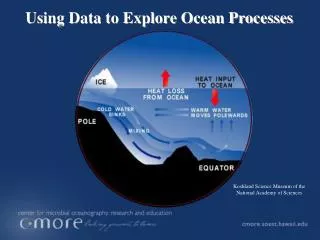
The era of the “omics” sciences
Genomics Transcriptomics Proteomics Metabolomics Phenomics Toxicogenomics Phylomics Foldomics Kinomics Interactomics Behavioromics Variomics Pharmacogenomics Just a few of the “omics” sciences
Functional Genomics Genomics Transciptomics Proteomics Metabolomics
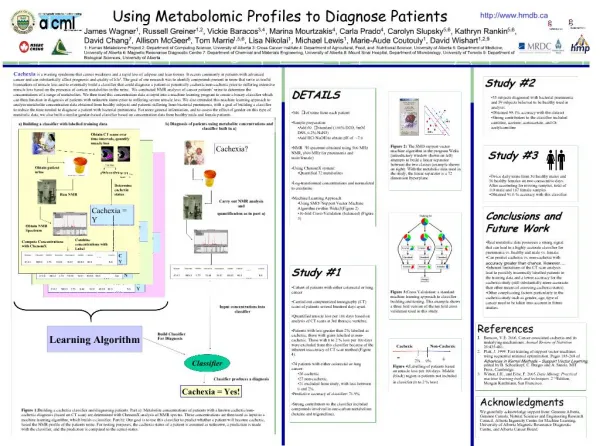
Metabolomics • Metabolites are all the small molecules in a cell (i.e. ATP, sugar, pyruvate, urea) • 3,000 metabolites in the human body (compared to 35,000 genes and approximately 100,000 proteins) • Most direct measure of cell physiology • Uses GC/MS and LC/MS to obtain measurements
Data • Currently only have GC/MS information • Missing values are very informative (below detection limits) • Imputed data using uniform random variables from 0 to minimum value • 105 metabolites • 58 individuals (42 “disease 1”, 6 “disease 2”, and 10 “controls”)
Confusion matrix Oob error = 20.69%
Visual Data • Dostat
Conclusions • Random forests, support vector machines, and neural networks are some of the newest algorithms for understanding large datasets. • There is still much more to be done.