
2012 Sales Performance Review and 2013 Targets Analysis
This document provides a comprehensive overview of the sales performance metrics for 2012 and outlines the targets set for 2013 across various business lines. The data reflects national and strategic sales for new and existing markets, with a focus on groups such as labor, trusts, and Medicare. It also highlights significant changes in performance and outlines the necessary steps to achieve targeted growth. Additionally, information on upcoming presentation workshops to enhance skills in design and delivery is included.

2012 Sales Performance Review and 2013 Targets Analysis
E N D
Presentation Transcript
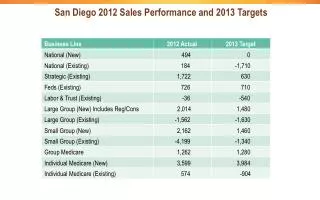
San Diego 2012 Sales Performance and 2013 Targets See the Notes pane for an explanation of this technique. Business Line 2012 Actual 2013 Target 494 0 184 -1,710 National (New) 1,722 630 National (Existing) 726 710 Strategic (Existing) -36 -540 Feds (Existing) 2,014 1,480 Labor & Trust (Existing) -1,562 -1,630 Large Group (New) Includes Reg/Cons 2,162 1,460 Large Group (Existing) -4,199 -1,340 Small Group (New) 1,262 1,280 Small Group (Existing) 3,599 3,984 Group Medicare 574 -904 Individual Medicare (New) Individual Medicare (Existing)
The Presentation Summit The finest learning event in the world for presentation prosSep 22-25 • Ft. Lauderdale FLwww.PresentationSummit.com925.398.6210
PresentationXpert Skills Workshops One-day workshops covering presentation design, PowerPoint technique, and delivery Mon, Apr 29San Diego Tue, Jun 4Denver CO Tue, Jun 11Seattle WA www.BetterPresenting.com/workshop925.398.6210














![Pass Your 70-494 Exam with Authentic 70-494 Dumps [PDF]](https://cdn4.slideserve.com/7887456/microsoft-dt.jpg)