Download
1 / 24
250 likes | 446 Views
UV-Vis Spectrometric Quantification of Nitric Oxide Production by the Anticancer Drug Suberoylanilide Hydroxamic Acid (SAHA,vorinostat). Ishita Patel. Presentation Outline. [1] Motivation for Research a. Histone Deacetylases Inhibitors

E N D
UV-Vis Spectrometric Quantification of Nitric Oxide Production by the Anticancer Drug Suberoylanilide Hydroxamic Acid (SAHA,vorinostat) Ishita Patel
Presentation Outline [1] Motivation for Research a. Histone Deacetylases Inhibitors b. The function of Nitric Oxide (NO) in the immune system [2] Summary of Research Goals [4] Establishing a working Protocol [5] Results [6] Discussion
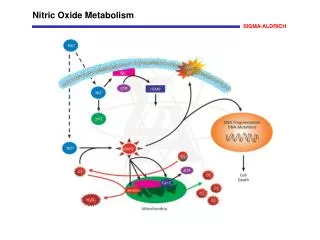
Histone deacetylase inhibition acetyl groups = shields positively charged amine groups Lysine, arginine = green spheres Hyperacetylated chromatin is transcriptionally active Hypoacetylated chromatin is transcriptionally silent CANCER = altered gene transcription and increased cell survival
SAHA structural analogs inhibit the function Of Zinc-dependent histone deacetylase HDAC8
Structural Features of Hybrid Polar Compounds cap group interacts with the rim of the catalytic tunnel hydrophobic spacer allows the molecule to lie into the catalytic tunnel zinc-binding group complexes the zinc ion at bottom of catalytic cavity. (SAHA)
[1] SAHA and HPCs Have Hydroxamate group at the end [2] Hydroxamates are known to release NO [3] Is NO release by HPCs important?
Research goals • [1] Experimental set up optimization • Check reproducibility of NanoDrop Spectrometer • b) Working with the Griess reagent • c) Determining Optimal Reactant Concentration • [2] NO release upon oxidation by metMb/H2O2 for each of the HPCs used • [3] What structural and chemical features of the different HPCs make these rates different?
The Kinetic Assay for NO production Reaction mixture [1] Hydroxamate: 250 µM [2] H2O2: 5 mM [3] Met Myoglobin: 10 µM Sample the reaction at different time points Add Catalase to stop the reaction…then… Add both components of the Griess System
Color Development time for Griess Reaction 500 µL of 100 µM sodium nitrite 250 µL of Solution A 250 µL of solution B
Standard Curve for the Griess reagent 200 µL of 20 - 250 µM sodium nitrite 100 µL of Solution A 100 µL of solution B
How reproducible are the measurements of the NanoDrop Spectrometer? The noise level (Error) does not get larger than 5% and all the rates of NO production are reproducible as can be seen from the overlay of trials A+B+C Is this the best way to analyze small samples of hard to obtain chemicals? The NanoDrop gives reproducible results and the sample volumes were as low as 200 µL. For samples that are expensive or in short supply, the NanoDrop is the best choice.
NO release rates for the HPCs used NO production rates have error bars of +/- 0.002µMper min (Standard Deviation of the Mean)
What structural and chemical features of the different HPCs make these rates different? Hydroxy Urea has the fastest NO release rate SAHA has the slowest NO release rate [1] The trend is that the larger molecules will have slower oxidation rates. [2] The Hydroxamide has to make contact with the HEME group inside Myoglobin, the smaller molecules have easier access to the HEME group.
CONCLUSIONS SAHA has the slowest NO release rate. SAHA is also the best anticancer drug of the compounds studied here The conclusion is that NO release is not the primary function of SAHA. The main function of SAHA is Histone deacetylase inhibition The relatively slow NO release rate means that SAHA is more resistant to oxidation This would enable SAHA to remain in the body for longer periods of time, requiring fewer doses of the drug to be administered to cancer patients.
I would like to express my sincere gratitude to the members of my thesis committee: Prof. Paul Dominguez Prof. Anthony Capetandes Prof. Uri Samuni Prof. Jorge Ramos