Download
1 / 6
60 likes | 219 Views
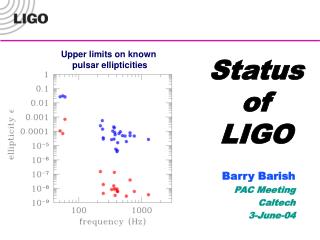
ANSYS simulation of LIGO ITM. Frequency shifts with time (dynamic surface heating). Simulation parameters. 2D axysimmetrical model Absorbed power in the coating: 10mW Waist of the gaussian heating beam: 3.4 cm Radiation into space @ 295K Coating modeling included in the simulation

E N D
ANSYS simulation of LIGO ITM Frequency shifts with time (dynamic surface heating)
Simulation parameters • 2D axysimmetrical model • Absorbed power in the coating: 10mW • Waist of the gaussian heating beam: 3.4 cm • Radiation into space @ 295K • Coating modeling included in the simulation We chose 295K because the measured temperature into Virgo towers is (22.0±0.1)°C
Modal analisys results • 2D axysimmetrical with coating, T=295K: • f0=14459.5199 Hz breathing mode • f0=9521.6059 Hz drum mode • 2D axysimmetrical with coating, T=300K: • f0=14467.1918 Hz breathing mode • f0=9526.46525 Hz drum mode Difference with your simulation: • (-14462.2638+14467.1918)/14465=8.5·10-5 • (-9523.18+9526.46525)/9524.8=8.6·10-5 We think this difference may be due to a non perfect match of our elastic parameters and different eigensolvers in Ansys and Comsol.
Thermal-modal analisyssteady state • 10mW absorbed into coating T=295K: • Δf/f0_breath=1.534·10-6 • Δf/f0_drum=1.633·10-6 • 10mW absorbed into substrate T=295K : • Δf/f0_breath=1.651·10-6 • Δf/f0_drum=1.614·10-6 • 10mW absorbed into coating T=300K: • Δf/f0_breath=1.283·10-6 • Δf/f0_drum=1.324·10-6 • 10mW absorbed into substrate T=300K : • Δf/f0_breath=1.380·10-6 • Δf/f0_drum=1.306·10-6 The differences with your results are of the order of 12-14%, these may be due to the fact that we used different temperature dependances of the elastic parameters. Anyway we cannot exclude that the temperature distribution inside the ITM is different as calculated by Ansys and Comsol...
Time dependent solution We read your data files. There are 121 points in both files, if sampled every 5 minutes, it means the time span is 10 hours. If we plot them against time, they look ok. But if we zoom the last hours.... Are we missing something?
Ansys data (T0=295K) Next step will be the solution for 10 mW absorbed into the substrate.