Download
1 / 38
380 likes | 397 Views
Explore findings from the comprehensive BASE study on indoor air quality in office buildings across the U.S., investigating health impacts, building characteristics, and environmental measures.

E N D
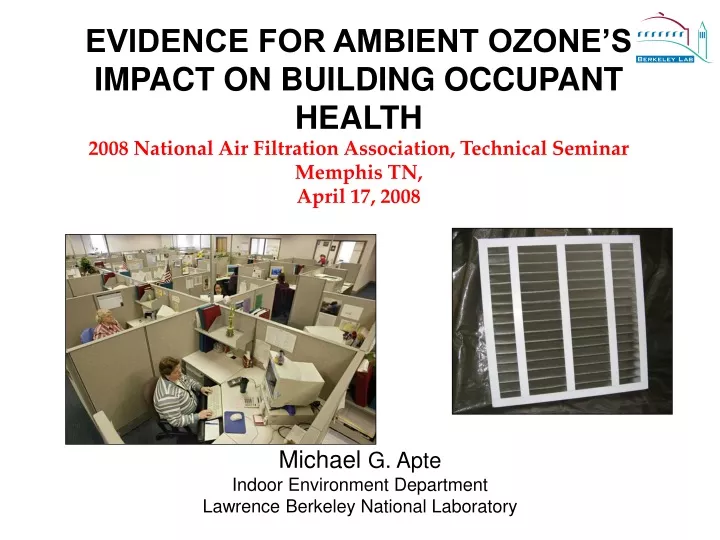
EVIDENCE FOR AMBIENT OZONE’S IMPACT ON BUILDING OCCUPANT HEALTH2008 National Air Filtration Association, Technical SeminarMemphis TN, April 17, 2008 Michael G. Apte Indoor Environment Department Lawrence Berkeley National Laboratory
Acknowledgements U.S. Environmental Protection Agency National Institute for Occupational Safety and Health US Department of Energy
What is BASE? • Building Assessment Survey and Evaluation Study • Cross-sectional study designed to define key characteristics of indoor air quality (IAQ) in 100 public and commercial office buildings across the continental U.S. • To fill a major data gap regarding indoor air quality in office buildings
What Were the Goals of the BASE Study? • Collect baseline data characterizing public and commercial office buildings • Examine relationships among parameters and between parameters and occupants’ perceptions and symptoms • Establish information on important indoor air parameters for policy decisions and guidance development • Assist in standardizing methodology and protocols for investigations • Enable the scientific and professional communities to advance knowledge and improve practices 4
BASE Study Design • Designed through a series of workshops of 50 national experts • Country divided into 10 climatic regions • Region identified for study in either winter or summer
Geographic Range • 25 States • 37 Cities • 52 Summer buildings • 48 Winter buildings • Variation • South Dakota: -18 oF (-28 oC) • Arizona: 108 oF (42 oC)
Conducting the BASE Study • Cities of 100,000 or greater population identified in each region • City randomly selected for study • Office Building • At least 50 employees >20 hrs./week • No highly publicized IAQ problems • Test space • At least 50 employees >20 hrs./week (needed >25 for questionnaire) • Served by no more than 2 air handling units • No more than three floors • Environmental sampling at three randomly selected indoor sites and one outdoor site close to outdoor air intake
BUILDING • CHARACTERISTICS • Use • Occupancy • Physical Location • Ventilation Equip. • Construction • Outdoor Sources • Smoking Policy • Water Damage • Fire Damage • Renovation • Pest Control • Cleaning Practices • ENVIRONMENTAL • MEASURES • Temperature • Relative Humidity • Carbon Dioxide • Carbon Monoxide • Sound • Light • Particles • VOCs • Formaldehyde • Biologicals • Radon • HVAC • CHARACTERISTICS • Specifications • Filtration • Air Cleaning • Humidification • Maintenance • Inspection Sched. • Supply Air Flow • Outdoor Air Intake • % Outdoor Air • Supply Air Temp. • Supply Air RH • Exhaust Air Flow • OCCUPANT • QUESTIONNAIRE • Work Place • Characteristics • Health and • Well-Being • Work Place • Environmental • Conditions • Job • Characteristics BASE Study Core Parameters
Ownership of BASE Buildings (n=100) • Private & Commercial: 41 • Academic: 15 • Government: 44 • Local: 15 • County: 9 • State: 13 • Federal: 7 8
Building Representativeness • Using DOE Survey as a basis for comparison, the BASE buildings • represent the largest 11% of US office buildings and • represent the office buildings where 73% of US office workers work
Building Related Symptomsfrom BASE Survey (BRS) Health effects which are linked to time spent in a building but to no specific known cause Examples • headache, fatigue • dry eyes, sore throat, nose/sinus congestion • tight chest, sneeze, shortness of breath, cough, wheeze
BRS in Analyses • Lower Respiratory • Tight chest, shortness of breath, cough, wheeze • LR: ≥1 of the above symptoms • Mucous Membrane • Dry eyes, sore throat, nose/sinus, sneeze • MM: ≥ 1 of the above symptoms • Fatigue/Tiredness - Concentration Difficulty • Dry Skin • Headache
Sensitive Individulals • Analysis Variable “Sensitive” • One or more of the following from Occupant Survey • Previously doctor diagnosed • Asthma • Allergies/Hayfever (mold,dust, pollen) • Eczema • Migraine • Self diagnosed sensitivity • tobacco smoke
Statistical Tools • Multivariate Logistic Regression (MLR) • “Is one population experiencing more illness than another population?” • Output: Odds Ratio (OR) • 1 = no increased risk between populations • OR>1 increased risk OR<1 decreased risk • Models adjusted for multiple personal, building characteristic and environmental variables • Used GEE (General Estimating Equation) to adjust for across-building effects • Interpret statistical analyses with caution • BASE study a cross-sectional design • Does not prove causality • Must show physical plausibility • Must be reproduced
Hypotheses I • Indoor air contaminant exposures are responsible in-part for BRS • Increases in per-person ventilation rates reduce prevalence of BRS
Sources Transformation Transport & Dispersion Health Effects Removal Pollutant Concentrations Exposure Effects Factors Governing Indoor Pollutant Concentrations and Health Chemistry Source Control Ventilation
CO2 Metric [dCO2] = Indoor [CO2] – Outdoor [CO2] Steady-State dCO2 ~ per-person ventilation rate BASE DatadCO2(ppm) Mean 250 Maximum 610 Number of Buildings: 100 • Office Building Ventilation • ASHRAE Standard 62-1999* … 10 Ls-1 person-1 • Approximate steady state indoor [CO2] of 870 ppm assuming outdoor [CO2] ~ 350 ppm (i.e., dCO2 ~ 520ppm) • *appropriate value for 1990s BASE Study
1 10 MM Dry Eyes Sore Thrt. Stuffy Nose/Sinus LResp ShortBrth. Tight Chest Cough Wheeze MLR Results: Dose-Response • Adjusteda analyses of trend used to identify dose-response relationships between dCO2 and symptoms • Four elevated CO2 concentration ranges vs. control • Statistically significant (p< 0.05) dose-response relationships with increasing dCO2 aAdjusted for age, gender, presence of carpet in workspace, smoking status, thermal exposure, RH, and 1,2,4-TMB and SENSITIVEe.
Principal Components Analysis (PCA) Source-based exposure metrics Office Machines Outdoor Air VOC concentrations PC1 (photocopiers) PC2 (motor vehicles) PC3 (tobacco smoke) PC4 (paint) in o-xylene m & p-xylenes ethylbenzene benzene ethyl acetate toluene butyl acetate styrene 1,2,4-trimethylbenzene naphthalene d-limonene buildings PCA dodecane n-decane deltaCO octane 1,4-dichlorobenzene a-pinene tetrachloroethene formaldehyde 1,1,1-trichloroethane Building Materials Smoking A few independent principal components related to the VOC sources Numerous, highly correlated VOCs
BRS Risk Factors • Air Conditioners • 1.3<OR<3.0 (Seppänen and Fisk 2002) • Mechanical Ventilation • Moderate evidence (Seppänen and Fisk 2002) • Low Ventilation Rates • <10 L/s per person • 1.1<OR<6 (Seppänen et al. 1999, Apte et al. 2000, Erdmann and Apte 2004) • HVAC Filters • Headache • Old filter ~ Intensity of headache (Clausen et al. 2002) • Performance • Old filters associated with Performance • New filter and vent. rate Performance • Old filter and vent. rate Performance (Wargocki et al. 2004)
Hypotheses II • Hypothesis 1. Increasing levels of outdoor ozone leads to higher prevalence of BRS among occupants within a building. • Hypothesis 2. Air filters are a sink for ozone and as contaminant sources that can increase occupant BRS. Some air filter materials in the presence of elevated ozone concentrations may increase occupants’ risk of BRS.
BASE Study Ozone Ozone and BASE • Outdoor ozone collected from EPA ambient sites • Only one BASE building 8-h ozone > NAAQS of 157 g m-3 during the study time period • Late afternoon ozone mean: 67.6 g m-3 (~34 ppb)
Crudest Relationships Annual Arithmetic Mean (AM) Ozone Prevalence Mucous Membrane Prevalence Lower Respiratory Prevalence Sore Throat Prevalence Wheeze Annual AM [Ozone] (ppb) Arithmetic Mean [Ozone] (ppb)
Multivariate BRS Riskper 10 g m-3 Late Work Day Ozone OR per 10 g m-3 outdoor ozone Solid circles statistically significant at 95% confidence level
VOC-Ozone Correlations Unsaturated C=O compounds are often products oxidation Toxic and irritating compounds BTEX compounds track nitric oxide that reacts with ozone
Hypothesis 1: Discussion • Interpret with caution - association does not prove causality • BRS most strongly associated with late workday ambient ozone averages • Reducing entrained ozone • to BASE lowest ozone level (4.9 μg m‑3) • assuming causality • could reduce upper respiratory, dry eyes, neurological and headache BRS by 45%, 35%, 35% and 33%, respectively • Known products of indoor ozone chemistry • Formaldehyde, acetaldehyde, pentanal, hexanal and nonanal • showed fairly large positive correlations with ozone • these compounds are known sensory irritants and some are known carcinogens
Filters in BASE Buildings • Most common types of single filter materials • fiberglass • polyester • synthetic • Most common blends of filter materials • cotton-polyester • cotton-synthetic • Final Model • polyester/synthetic filter material vs. fiberglass filter - 34 Buildings
Joint Risk Ozone >67.6 g m-3 and Poly/Syn Filters Solid circles statistically significant at 95% confidence level
Risk from Ozone >67.6 g m-3 in Poly/Syn Filter Buildings Solid circles statistically significant at 95% confidence level
Risk from Poly/Syn relative to Fiberglass Filters: Ozone >67.6 g m-3 Solid circles statistically significant at 95% confidence level
Hypothesis 2: Discussion • BRS - Polyester/synthetic filter materials highly, significantly associated >> with higher ozone • physico-chemical mechanisms unknown • Results are statistical associations • Replication needed in addition studies • Suggests that ozone mitigation and proper filter selection • Reduce BRS 30% to 60% in buildings • Possible mitigation strategies • Reduce ambient ozone -> Clean Air Act • Outside air cleaning for HVAC systems • Appropriate HVAC filter selection -> research needed
Discussion: Outside Air Cleaning • ASHRAE 62.1-2007 requires ozone air filtration • [O3] exceeds 160 ppb • Current public review of new trigger level related to recent lowering of ozone criteria level • 80 ppb • Expands number of US counties from <100 to >300 • Activated carbon air filtration shown effective • Activated carbon lifetime long for O3 removal • Low ∆P carbon impregnated air filters available • Research needed to characterize lifetime and effectiveness of low ∆P filters • Important role of industry in this process • Potential increase in market for activated carbon impregnated filters
Further Research Field Studies Filter Studies • Surface chemistry • Materials physics and chemistry • Intervention studies Cross-sectional studies Conclusions BRS is ventilation (dCO2) dependent Ambient ozone is associated with increased BRS Ozone-initiated chemistry a likely cause of symptoms Ozone interactions with HVAC system materials is a likely factor in causation of BRS More research needed to confirm causation
Challenge Question What will air filtration look like in 20 years? DOE: Net Zero energy buildings Cost of energy Climate change Poorer outdoor air quality More awareness of indoor air quality and health/productivity effects