Download
1 / 24
240 likes | 357 Views
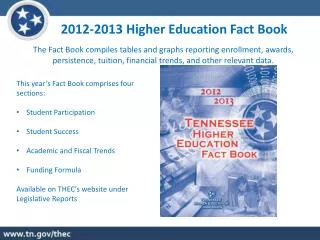
2012-2013 Higher Education Fact Book. The Fact Book compiles tables and graphs reporting enrollment, awards, persistence, tuition, financial trends, and other relevant data. This year’s Fact Book comprises four sections: Student Participation Student Success Academic and Fiscal Trends

E N D
2012-2013 Higher Education Fact Book The Fact Book compiles tables and graphs reporting enrollment, awards, persistence, tuition, financial trends, and other relevant data. • This year’s Fact Book comprises four sections: • Student Participation • Student Success • Academic and Fiscal Trends • Funding Formula • Available on THEC’s website under Legislative Reports
2012 Fall Enrollment Total 2012 Tennessee Fall Enrollment 400,908
Fall Headcount by System/Sector Fall Total HC 2010 406,755 2011 407,599 2012 400,908
Public Postsecondary Fall Enrollment Trends Recession Ends June 2009 Recession Begins Dec 2007
Fall Public Enrollment: 1979-2012 1973-75 Stagflation
Fall Public Enrollment: 1979-2012 1973-75 Stagflation
Fall Public Enrollment: 1979-2012 1973-75 Stagflation
Current and Projected Number of High School Graduates Source: Western Interstate Commission on Higher Education, “Knocking at the College Door”
Current and Projected Number of High School Graduates Source: Western Interstate Commission on Higher Education, “Knocking at the College Door”
Fall Public First-Time Freshmen Enrollment
Postsecondary Enrollment of Recent Tennessee High School Graduates Source: IPEDS, Residence and Migration Survey; THEC, Profiles and Trends Report
Share of Recent High School Grads Staying In-State Source: IPEDS, Residence and Migration Survey; THEC, Profiles and Trends Report
Retention Rates First-Time, Full-Time Freshmen Entering During the Fall and Returning the Following Fall
Six-Year Graduation Rates First-Time, Full-Time Freshmen Cohorts
Average Undergraduate Annual Tuition and Mandatory Fees by Institution Type
Average Undergraduate Annual Tuition at 4yr Institutions: Adjusted for Inflation 10 year percent change – 112% Percent change adjusted for inflation – 66%
Average Debt for 2010-2011 TN Public University Graduates Source: Institute for College Access & Success, “The Project on Student Debt.”
www.tn.gov/thec/Legislative/Reports.html Please contact Kimberly Martin with any questions. Kimberly.D.Martin@tn.gov (615) 532-6613