
§ 5.2
§ 5.2. Normal Distributions: Finding Probabilities. z. 0. 1. 2. 3. 3. 2. 1. The Standard Normal Distribution. The standard normal distribution is a normal distribution with a mean of 0 and a standard deviation of 1. The horizontal scale corresponds to z - scores.

§ 5.2
E N D
Presentation Transcript
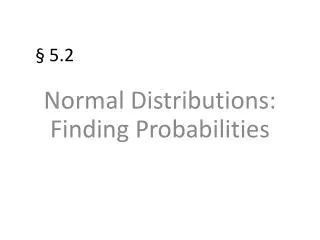
§ 5.2 Normal Distributions: Finding Probabilities
z 0 1 2 3 3 2 1 The Standard Normal Distribution The standard normal distribution is a normal distribution with a mean of 0 and a standard deviation of 1. The horizontal scale corresponds to z-scores. Any value can be transformed into a z-score by using the formula
z 0 1 2 3 3 2 1 The Standard Normal Distribution If each data value of a normally distributed random variable x is transformed into a z-score, the result will be the standard normal distribution. The area that falls in the interval under the nonstandard normal curve (the x-values) is the same as the area under the standard normal curve (within the corresponding z-boundaries). After the formula is used to transform an x-value into a z-score, the Standard Normal Table in Appendix B is used to find the cumulative area under the curve.
Area is close to 1. z Area is close to 0. 0 1 2 3 3 2 1 z = 3.49 z = 3.49 z = 0 Area is 0.5000. The Standard Normal Table • Properties of the Standard Normal Distribution • The cumulative area is close to 0 for z-scores close to z = 3.49. • The cumulative area increases as the z-scores increase. • The cumulative area for z = 0 is 0.5000. • The cumulative area is close to 1 for z-scores close to z = 3.49
The Standard Normal Table Example: Find the cumulative area that corresponds to a z-score of 2.71. Appendix B: Standard Normal Table Find the area by finding 2.7 in the left hand column, and then moving across the row to the column under 0.01. The area to the left of z = 2.71 is 0.9966.
The Standard Normal Table Example: Find the cumulative area that corresponds to a z-score of 0.25. Appendix B: Standard Normal Table Find the area by finding 0.2 in the left hand column, and then moving across the row to the column under 0.05. The area to the left of z = 0.25 is 0.4013
2. The area to the left of z = 1.23 is 0.8907. z 0 1.23 1. Use the table to find the area for the z-score. Guidelines for Finding Areas • Finding Areas Under the Standard Normal Curve • Sketch the standard normal curve and shade the appropriate area under the curve. • Find the area by following the directions for each case shown. • To find the area to the left of z, find the area that corresponds to z in the Standard Normal Table.
3. Subtract to find the area to the right of z = 1.23: 1 0.8907 = 0.1093. 2. The area to the left of z = 1.23 is 0.8907. z 0 1.23 1. Use the table to find the area for the z-score. Guidelines for Finding Areas • Finding Areas Under the Standard Normal Curve • To find the area to the right of z, use the Standard Normal Table to find the area that corresponds to z. Then subtract the area from 1.
4. Subtract to find the area of the region between the two z-scores: 0.8907 0.2266 = 0.6641. 2. The area to the left of z = 1.23 is 0.8907. 3. The area to the left of z = 0.75 is 0.2266. z 0 1.23 0.75 1. Use the table to find the area for the z-score. Guidelines for Finding Areas • Finding Areas Under the Standard Normal Curve • To find the area between two z-scores, find the area corresponding to each z-score in the Standard Normal Table. Then subtract the smaller area from the larger area.
z 0 2.33 Guidelines for Finding Areas Example: Find the area under the standard normal curve to the left of z = 2.33. Always draw the curve! From the Standard Normal Table, the area is equal to 0.0099.
0.8264 1 0.8264 = 0.1736 z 0 0.94 Guidelines for Finding Areas Example: Find the area under the standard normal curve to the right of z = 0.94. Always draw the curve! From the Standard Normal Table, the area is equal to 0.1736.
0.8577 0.0239 0.8577 0.0239 = 0.8338 z 1.98 0 1.07 Guidelines for Finding Areas Example: Find the area under the standard normal curve between z = 1.98 and z = 1.07. Always draw the curve! From the Standard Normal Table, the area is equal to 0.8338.