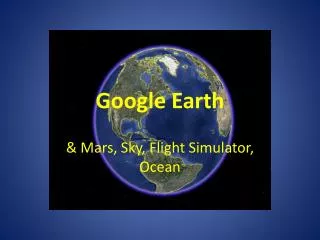
Google Earth
Explore the applications of Google Earth in Ham radio, including tracking, weather data integration, path calculations, and GIS functionalities. Learn about KML file formats and implementing applications in VB.NET and ASP.NET. Discover how to import APRS data, weather information, and create visual representations for radio-related activities. With Google Earth, enhance your Ham radio experience and elevate your wireless systems expertise.

Google Earth
E N D
Presentation Transcript
Google Earth Applications for Ham Radio Radioactive Networks Pty Ltd Darryl@radio-active.net.au
Who Am I? • Darryl Smith, VK2TDS, B.E. • Self Employed Positioning Consultant • Expert on Wireless Systems
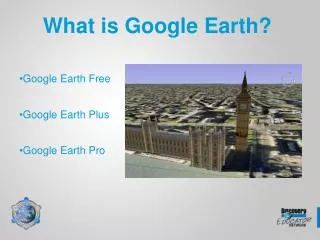
The Talk • Introduction to Google Earth • Applications for Ham Radio • Tracking • Weather • Path Calculations • GIS • File Format - KML • Implementing Applications • VB.NET • ASP.NET
Google Earth - Licensing • Free to Non-Commercial Uses • $20/Year upgrade for GPS functionality, and route editing • $400/Year Commercial per seat • Movie Making - $200/Year • Premium Printing - $200/Year • GIS Data Import - $200/Year • Traffic Counts Data - $200/Year • Shopping Centre Data - $200/Year • Server Licensable Separately
Applications for Ham Radio • APRS / Tracking • Weather • Path Calculations • GIS Applications
History • Originally released as Keyhole Viewer by ‘Keyhole’ • Most of the functionality was there in 2002, but Hardware and Networks were still lacking • Google purchased Keyhole in 2004, about the time of the DCC
Example of User • Beyond Blue – a suicide prevention group for farmers in the Australian Bush organized a drive of vintage tractors through the Simpson Desert • They wanted to get community involvement so they set up a Google Earth feed showing their current position
APRS Tracking • APRS Tracking is possible in Google Earth. • I have been importing APRS data into my own server software very successfully.
Weather • Importing Weather Data into Google Earth from CWOP is fairly straightforward • Vectors can be added for wind direction and velocity • Graphics can show the rainfall • Icons can be used for Temperature • Graphs can be used to show trends • Text Boxes can be used to provide all data
Image Import • Overlays can be loaded periodically, such as with weather radar data • These images can refresh automatically periodically • Custom datasets can also be used
Path Calculations • Paths can be drawn on the map. These can be locked to the ground, or at a height. This can be done to model antenna paths. • Without extra software it cannot do fresnel zones
Building Applications • Visual Basic • ASP.NET • PHP
Google Earth Back End • KML, an XML variant is used to draw • KML is hierarchical • That is elements can be added at any point…
File Format / Architecture • Essential Information :- • KML Tutorial • http://www.keyhole.com/kml/kml_tut.html • KML Specification • http://www.keyhole.com/kml/kml_doc.html
Place a line… Inside a Placemark <LineString> <altitudeMode>absolute</altitudeMode> <coordinates> -112.2550785337791,36.07954952145647,2357 -112.2549277039738,36.08117083492122,2357 -112.2552505069063,36.08260761307279,2357 -112.2564540158376,36.08395660588506,2357 </coordinates> </LineString>
Folders <Folder> <name>My House</name> . . . </Folder>
Network Link <NetworkLink> <refreshVisibility>0</refreshVisibility> <refreshInterval>121</refreshInterval> <Url> <href>//myServer/Googleearth/example.kml</href> </Url> <visibility>1</visibility> <name>TestNetworkLink</name> </NetworkLink>
Two Types of Interface • Standard and ‘View’ based • Standard outputs data regardless of zoom level, area of display etc. • ‘View’ sends the extents of the view to the server whenever the data is downloaded. • View allows only appropriate data to be sent
KML can point to a service. So if you pan around a map, when you stop, the service is asked to return a relevant KML file. It might, for example, take the bounding box of the area on screen and reach into a database to draw up data for that geography and place it on top of Google Earth.
Example of a use of View Based output • Take the example of using GoogleEarth to display Weather Data. • Using the extents data you can determine the ZOOM level. • You can then send the NOAA Weather station data when zoomed out • Then as you zoom in CWOP stations are also displayed
Building Applications A Simple KML File <Placemark> <description>Description</description> <name>Server Name</name> <point> <coordinates>151,-34,0</coordinates> </point> </Placemark>
Building Applications – VB.NET Dim XTW as new XMLTextWriter (Filename, Nothing) xtw.WriteStartElement("Placemark") xtw.WriteElementString(“description”, “Description Text”) xtw.WriteElementString("name", “Server name”) Xtw.WriteStartElement(“point”) Xtw.WriteElementString(“coordinates”, “151,-34,0”) Xtw.WriteEndElement ‘point Xtw.WriteEndElement ‘Placemark Xtw.flush Xtw.close
Building Applications – ASP.NET Private Sub Page_Load () Handles MyBase.Load With Page.Response .Clear(); .CacheControl = "no-cache“; .Expires = -1 .AddHeader("Pragma", "no-cache" & vbCrLf) .AppendHeader("content-disposition", "inline; filename=ge.kml") .Write("<?xml version=“1.0” ?>” & vbCrLf) line=“kml xlms=“http://earth.google.com/kml/2.0” >” .Write (line & vbCrLf) .WriteFile(“filename.kml" & vbCrLf) .Write("</kml>" & vbCrLf) End with End Sub
Building Applications – PHP - 1 • <?php • $lat_int = rand(-90, 90); • $lat_dec = rand(0, 1000000000); • $lon_int = rand(-180, 180); $lon_dec = rand(0, 1000000000); • $lat = $lat_int.'.'.$lat_dec; • $lon = $lon_int.'.'.$lon_dec; • $response = '<Placemark>'; • $response .= '<description>Generates a random placemark on each call to the server</description>';
Building Applications – PHP - 2 • $response .= '<name>Random KML server</name>'; • $response .= '<visibility>1</visibility>'; • $response .= '<Point>'; • $response .= "<coordinates>$lon,$lat,0</coordinates>"; • $response .= '</Point>'; • $response .= '</Placemark>'; • echo $response; ?>
$coords = preg_split('/,|\s/', $BOX); • $bl_lon = $coords[0]; • $bl_lat = $coords[1]; • $tr_lon = $coords[2]; • $tr_lat = $coords[3]; • // calculate the approx center • $userlon = (($coords[2] - $coords[0])/2) + $coords[0]; • $userlat = (($coords[3] - $coords[1])/2) + $coords[1];