Download
1 / 6
70 likes | 184 Views
mirror. real structure. mirror image. Fig. S1 The real [Mn 9 ] (left) and its mirror image (right) obtained by applying the the space reversal parity operator. Fig. S2 The real (left) and the ideal (right) pcu net that 1 adopts.

E N D
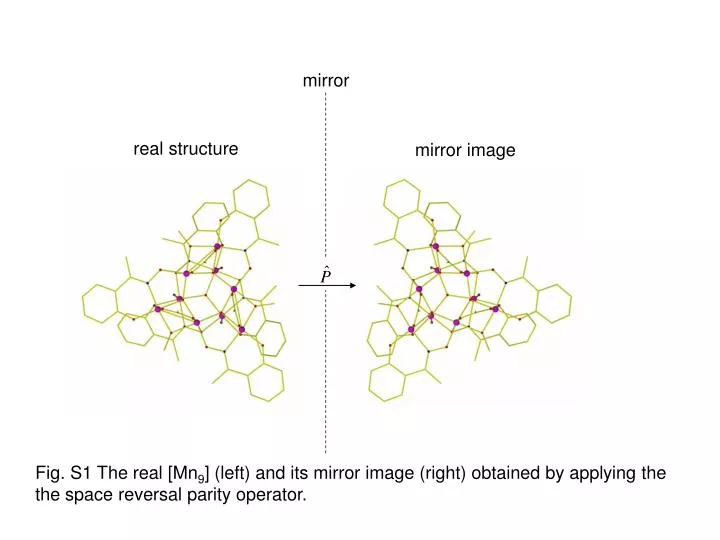
mirror real structure mirror image Fig. S1 The real [Mn9] (left) and its mirror image (right) obtained by applying the the space reversal parity operator.
Fig. S2 The real (left) and the ideal (right) pcu net that 1 adopts. Pink spheres represent [Mn9] and the lines the C-H···O interactions.
Fig. S3 Plot of χMT vs T for complex 1 measured in an applied field of 0.1 T
Fig. S4 Plot of χM’T vs T for complex 1 measured in a 3.5G ac field and the indicated frequencies.
Fig. S5 Plot of χM’’ vs T for complex 1 measured in a 3.5G ac field and the indicated frequencies.
Fig. S6 Arrhenius plot combining single crystal dc relaxation data and data obtained by varying the frequency of oscillation of the ac field. The slope (dashed line) gives Ueff = 30 K.