Download
1 / 41
420 likes | 607 Views
The Earth and its Atmosphere. This chapter discusses: 1. Introduction (not in book) 2. Gases in Earth's atmosphere 3. Vertical structure of atmospheric pressure & temperature 4. Types of weather & climate in the atmosphere.

E N D
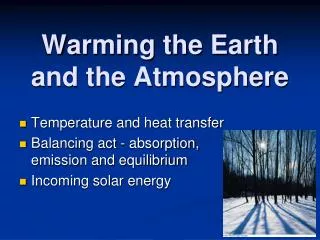
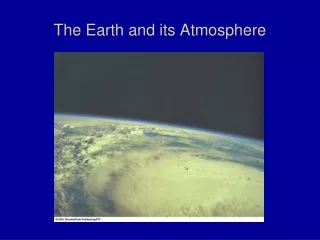
The Earth and its Atmosphere • This chapter discusses: • 1. Introduction (not in book) • 2. Gases in Earth's atmosphere • 3. Vertical structure of atmospheric pressure & temperature • 4. Types of weather & climate in the atmosphere
Meteorology Timeline(Some interesting meteorological periods and event)Meteorology as an exact science is relative young but….measurements have been made through recorded history • 400 B.C. – Rainfall measured in India. • Pre-1600’s – Predictions were based on recurring patterns (example: when the wind switches from east to south, expect storms). There was no understanding of why these recipes worked (and why they did not). • 1600’s – Measurements of surfaces quantities began. Isaac Newton develops his 3 laws of motion, the beginnings for a mathematical description of meteorology. • 1800’s – The beginning of determinations of the forces, which act to change the weather, some simple theories and classifications are developed. • 1900’s – The understanding that the vertical structure of the atmosphere is important and must be measured. • 1944 – The first quantitative map identifying the jet stream. Mid 1940’s to 1950’s – Radars were beginning to be used for weather experiments. • 1955 – The first operational weather prediction model was ran on an IBM computer. • 1960 – The first weather satellite was launched into space (Tiros 1). • 1974 – The first Geostationary Operational Environmental Satellite (GOES) was launched. • Early 1990’s – The first NEXt generation RADar (WSR-88D) was implemented at a NWS weather forecast office. • 2000's – The Weather Research & Forecasting (WRF) numerical prediction model was created to merge the forecast and research communities together. • This decade – Dual Doppler radars and the next generation GOES satellites being used operationally.
Basic Definitions That Are Often Misused and Misunderstood Weather – the state of the atmosphere at a given location and time along with the short term changes in that state (e.g., temperature, wind speed and direction, precipitation, etc.) Climate – the “average” state of the atmosphere at a given location and over a given period of time and the long term changes in that “average” condition. Typically included in the definition of “Climate” is the typical range of extremes (example: Denver in September has an averaged temperature of 62.4°F with daily averaged highs between 82 – 73°F and lows between 53 – 42°F). Meteorology – the study of the atmosphere and atmospheric phenomena/processes as well as the atmosphere’s interaction with the earth’s surface, oceans, and life in general. Example of processes that effect weather: • Energy from the sun • Effects of the earth’s surface • Clouds • Effects of water (in all 3 phases) • Movement of air • Societal Impacts (to a degree)
What is a “Real” Meteorologist? • An individual who shows aptitude in the following fields: • Mathematics • Physics • Chemistry • Geography • Computer Science • An individual who uses these (above mention) skills to develop a better understanding on how the atmosphere behaves in the short- and long-term. • Moreover, the individual must have completed the requirements for a college degree (B.S.) in meteorology/atmospheric science.
Naming Convention of Meteorological Graphs and Maps Graphs and maps help to display and illustrate certain meteorological principles and data in a more concise way. Most graphs fall under 2 categories. Vertical Profile or Profile – a map or graph that displays variables as a function of the distance above the earth surface over a single point.
Horizontal / Plan-view Map – a type of map/graph that displays information on a horizontal plane with a geographical map usually as set as a background, which makes it easier to determine geographical location.
Vertical Cross-Section – is a map/graph that looks at the atmosphere in a vertical plane along a horizontal line. It is useful to illustrate atmospheric characteristic associated with particular phenomena (e.g., fronts, thunderstorms, etc.). Vertical cross-section can be thought of as taking a slice of the atmosphere.
Meteorological Units of Measurement In meteorology, for the most part, the International System of Units (SI) are used instead of the Imperial Units (English/United States). The SI system is based on the metric units of measure which use meter-kilogram-second (mks) system instead of centimeter-gram-second (cgs) system. Distance
Meteorological Units (cont.) Note: There is not a degree character for the Kelvin scale. Temperature
Meteorological Units (cont.) Pressure * The pressure observed at sea-level under standard atmospheric conditions.
Solar Energy as Radiation • This image shows the relative sizes and positions of the planets in our solar systems including the dwarf planet known as Pluto. • The sun is an average size star located at the center of the solar system. Earth is approximately 150 million kilometers away from the sun, yet solar radiation (radiant energy) drives the earth's weather. • This radiant energy provided by the sun keeps the earth's average global surface temperature close to 15°C (59°F) but a wide range of temperatures is observed as well. • Examples of the temperature extremes that can be experienced on the earth surface are 1) on a chilly Antarctic night, temperatures can drop below -85°C (-121°F) and 2) over a hot subtropical desert (like the Sahara Desert), the thermometer can climb to 50°C (122°F).
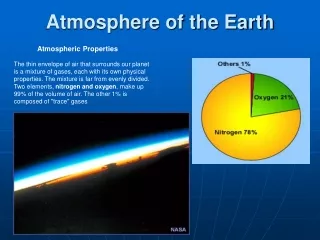
Earth's Atmosphere • Our atmosphere is a thin, gaseous shell made up of mostly nitrogen and oxygen, with small amounts of other gases. • About 99% of atmospheric gases, including water vapor, extend only 30 kilometer (km) above earth's surface but the last 1% reaches heights greater than 600 km. • So a majority of our atmosphere is below 30 km in height. There is no true hardtop of the atmosphere but rather the earth's atmosphere and space merges together. • At 600 km, the mean free path between air molecules is about 10 km. • Most of our weather, however, occurs within the first 10 to 15 km.
Highly Variable 99% of the atmosphere Greenhouse Gases • Composition of the Atmosphere can be separated into 2 categories: • Permanent Gases • Variable Gases
Permanent Gases 99% of the earth's atmosphere is made up of predominantly two gases: 1) Oxygen (O2) and Nitrogen (N2). Out of a possible 100%, N2 consists of 78% of the earth's atmosphere. O2 is responsible for 21% of the earth's atmosphere and the remaining 1% is a potpourri of different trace gases. Permanent gas percentages represent a constant amount of gas which are very slow to change but cycles of destruction and production are constantly maintaining this amount on a daily, weekly and yearly basis. Variable Gases Variable gases concentration can change greatly from day-to-day or year-to-year depending on the gas constituent. Sometimes, changes in these trace gases’ concentrations can have a large effect.
Do these trace/variable gases play an important role in the atmosphere? • Take water vapor (H2Ov) for example, the percentage of water vapor can vary anywhere from 0% to 4% which is dependent on the evaporation and condensation rates over a particular location. If the condensation rate dominates then the chances of precipitation increase and vice versa with evaporation. • However, as a society, we are almost always concerned about the possibility of rain/snow! • Sometimes, changes in these trace/variable gases can have a large effect. • H2Ov (water vapor) are invisible and concentration varies at different latitudes. • becomes visible when changing into a larger liquid or solid particles, such as cloud droplets and ice crystals. • Condensation – vapor state to liquid • Evaporation – liquid to vapor • Latent heat is release during condensation; this is a source of atmospheric energy beside the sun (drives storms) • It is a form of green house gas because it absorbs outgoing radiant energy (e.g. glass of a green house)
Other Trace Gases’ Effect • CO2 is produced by animals and humans, volcanoes, coal burning, and deforestation. • Removed by the Ocean (dissolved) and photosynthesis. • The ocean holds an estimate of more 50 times the total of the atmosphere concentration. • Before the industrial revolution (pre-1800), CO2 (280 ppm) concentration remains steady but since after 1800 it has been on the incline by more than 25%. • Presently, it is increasing annually by 0.4% or 1.5ppm/yr. • An important greenhouse gas but a high concentration is blamed for global warming. • CFC (from refrigerants, propellants) acts to destroy O3. • O3 is the main ingredient for photochemical smog at the surface. • 97 % are found in the stratosphere; blocks out UV rays.
Atmospheric Gases • Nitrogen, oxygen, argon, water vapor, carbon dioxide, and most other gases are invisible. • Clouds are not gas, but condensed vapor in the form of liquid droplets. • Ground based smog, which is visible, contains reactants of nitrogen and ozone (bad type).
The atmospheric carbon dioxide cycle • CO2 is being released into the atmosphere via man-made and natural sources. • An excess in CO2 concentration in the atmosphere will rise the overall global temperature if the CO2creation process does not equal the removal process. • The ocean is a huge sink of CO2 along with the photosynthesis process which helps to remove the CO2 from the atmosphere.
Increasing Greenhouse Gases • The 50-year graph (left) provides an example on how the CO2 concentration can vary on a seasonal basis with vegetation growth peaking during the spring and summer (gray line is the actual observation and the blue line is the yearly average). • In order to get a better understanding on how the CO2 concentration has increase rapidly, let's look at the last 1000 years. • Most of the past CO2 concentration data are acquired from ice core samples. The 1000-year graph (right) shows an actual decline in CO2 concentration from 1500 to 1600 when Europe experienced a mini-ice age. • From 1800 to the present, the CO2 concentration accelerates almost exponentially.
Aerosols & Pollutants • Human and natural activities displace tiny soil, salt, and ash particles as suspended aerosols, as well as sulfur dioxide, nitrogen dioxide, and hydrocarbons as pollutants. • In addition, atmosphere contains impurities from natural (dust and soil) and man-made sources called aerosols. • Aerosols are disbursed into the atmosphere by the wind and helps with the formation of precipitation (to be discussed further in depth on a later module). • Pollutants are associated with man-made impurities, such as carbon monoxide (CO), that cause health hazard.
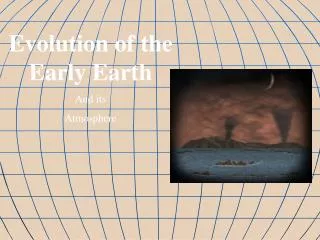
Early atmosphere (4.6 billion yr ago) • 1st atmosphere made up of helium and hydrogen escaped into space. • too light • 2nd atmosphere from volcanoes and constant “outgassing” of H2Ov (80%) and CO2 (10%) and a few % of N2. • As rain fell for 1000s of years, forming lakes, rivers, and oceans, CO2 were dissolved or became carbonate sedimentary rock, limestone. • N2 started to dominated with the depletion of CO2 (not chemically active) • O2 were produced either by: • H2O being broken down by the sun ray • Plants forming in an O2 free environment
Pressure & Density • Weight = mass × gravity (kg) • Density = mass ÷ volume (kg/m3) • Pressure = force ÷ area (lb/in2) • Gravity pulls gases toward earth's surface, and the whole column of gases weighs 14.7 psi at sea level, a pressure of 1013.25 mb or 29.92 inHg. • Pressure and density decreasing with height is not a linear relationship but rather a logarithmic relationship. • Interestingly, the weight of the atmosphere is approximately 5600 trillion (5.6 quadrillion) tons.
Vertical structure of atmospheric pressure & temperature • The properties of the atmosphere change as one moves away from the surface, particularly, pressure, temperature and density. • Air molecules are held closer near the earth by gravity, this effect the numbers of molecules in a given volume. • Air density is the greatest at the surface because it is defined as the numbers of air molecules in a volume. • Air molecules have weight => act as a force upon the earth => this force can measured => air pressure or atmospheric pressure – the amount of force exert over a surface area.
Vertical Pressure Profile • This figure illustrates the rapid decrease of air pressure with height • Pressure increases at a curved rate (logarithmically) proportional to altitude squared, but near the surface a linear estimate of 10 mb per 100 meters works well. • Basically, half the atmosphere (500mb) is below the elevation of 5.5 km or 18,000 ft. • Mount Everest elevation is approximately 9 km or 29,000ft above sea-level. The pressure reading should be around 300 mb there nearly 70% of the air molecules that exist in the entire atmosphere is below Mount Everest. • The atmosphere stretches in the vertical for hundreds of kilometer until eventually becoming thinner and thinner to the point of merging with space. This level where the atmosphere and space merges is approximately 600 km.
Atmospheric Layers • Five layers are defined by constant trends in average air temperature (which changes with pressure and radiation), where the outer exosphere is not shown. • Temperature starting at the surface usually decreases with height until 11 km (36,000 ft or 7 mi). • This is due to sunlight warming the earth’s surface and which in turn the surface warms the air above it.
Vertical Temperature Trends • The rate at which temperature decreases with height is called a lapse rate. • The “average” lapse rate is 6.5 C/1000 m • Lapse rate varies daily and even hourly • On occasion, temp increases with height, this is called a temperature inversion. • An isothermal layer is defined as a region where there is no change in temps with height. • Radiosonde is used to measure temperature throughout the atmosphere.
Troposphere is located from the surface to about 11 km above mean sea-level (MSL). This is where most of the weather takes place. Normally, temperature decreases with height, where the temperature no longer decreases with height over a large depth marks the top of the troposphere. Stratosphere is the layer above the troposphere and characterized by temperature increasing with height. This warming is associated with the absorption of sun's energy by the ozone layer.Tropopause – is the interface or boundary separating the troposphere and stratosphere. Little mixing occurs between the two layers. Where air mixes from the two layers occurs near jet streams where tropopause tends to break or weaken. The tropopause height varies with latitude and seasons.Mesosphere – is located above the stratosphere. Atmospheric density is extremely low at this level and even though about 21% of the atmosphere still consists of oxygen, life can only be sustained with a breathing apparatus. On the average, this is the coldest layer of the atmosphere. It has an average temperature of -90 °C.Thermosphere – is where air molecules are few and far between. Atmosphere, as we know it, in this region is unrecognizable. Lighter molecules dominate and travel very fast due to the strong absorption of the sun’s energy. Air temperature can exceed 500 °C. Due to the few molecules in this region, one would not feel hot but rather quite frigid if shielded from the sun. Stratopause and Mesopause – are the boundaries the stratosphere-mesosphere and mesosphere-thermosphere, respectively.
Atmospheric Mixture & Charge Electrical Properties Temperature Composition Additional layers include: a) the homosphere with 78% nitrogen and 21% oxygen b) the poorly mixed heterosphere c) the electrically charged ionosphere
Exosphere – is upper limit of the atmosphere where space and atmosphere merge together. Molecules and atoms in this region can escape the earth’s gravity. • Homosphere – is the layer of the atmosphere where the composition of the atmosphere remains constant (78% Nitrogen and 21% Oxygen). This uniformity is achieved through turbulent mixing. This layer goes up from the surface to 85 km, where the thermosphere begins. • Heterosphere – starts at 85 km above the earth’s surface and extend out into free space. Collision between atoms and molecules are infrequent so the atmosphere is unable to keep up the mixing process. Heavier elements and molecules settle to the bottom of the layer while the lighter materials rise to the top. • Ionosphere – is not “real” a layer but rather an electrified region within the upper atmosphere where fairly large concentrations of ions and free electrons exist. It extends from 60 km above the earth’s surface to the top of the atmosphere. It also plays a major role in radio communication.
Radio Wave Propagation AM radio waves are long enough to interfere with ions in the sun-charged D layer, but at night the D layer is weak and the AM signal propagates further, requiring stations use less power.
Weather & Climate • Weather is comprised of measured variables which can be predicted: • Air temperature – how hot or how cold the air is? (degree of hotness and coldness) • Air pressure – the force of air exerted above an area • Humidity – a measure of the amount of water vapor (moisture) in the air • Clouds – a visible mass of tiny water droplets and/or ice crystals that are above the earth’s surface • Precipitation – any form if water, either liquid or solid (rain, ice, or snow), that falls from clouds and reaches the ground • Visibility – the greatest distance one can see (fog and pollutants) • Wind – the horizontal movement of air • Climate represents long-term (e.g. 30 yr) averages of weather (Climatology); can also be thought of as a local, regional, or global trend.
Satellite Instruments • Meteorologists may study larger weather patterns with space borne instruments, while ground-based tools often measure a single point. • Satellites provide a large view of the present weather Geostationary Satellite (36,000 km or 22,300 mi) – travels the same rate as the earth axis rotation. It allows for continuous coverage over a certain area
Middle latitudes (mid-latitudes) is where the US is located between 30°N to 50°N. Known as the “active weather latitudes” – hurricanes, tornadoes, thunderstorms, hails, flash floods, blizzards, etc are found in this region.•Tropics – equator to 30°N or S•Different Storm sizes 1) Mid-latitude Cyclonic Cyclone (middle-latitude cyclonic storm, mid-latitude cyclone, extratropical cyclone) – storms outside the tropics. It spins counterclockwise in the NH. Over 2000 km in size 2) Hurricane (tropical cyclone) – smaller but more vigorous storm has a tropical origin. ~ Spins the same way as (middle-latitude cyclonic storm but usually have higher sustain surface winds (> 74 MPH) ~ An eye of a hurricane is calm and clear. The lowest pressure of the storm is located there. Highest winds are located just outside the eye in a region called the eyewall. 3) Thunderstorms are even smaller. Developed from cumulus cloud (Puffy white cloud with a vertical growth to them). ~ Lightening, thunders, strong gusty winds, heavy rain, and possible hail are associated with T’storms ~ Organized T’storms (supercell) can produce tornadoes. ~Tornado wind can exceed 230 mph but are usually less than 140 mph.
Surface Weather Map • Meteorologists generate diagrams of observed weather from ground-based instruments. • This surface map overlaps in time with the previous satellite but a radar image can also be overlaid to provide a better representation of the present weather/atmosphere.
Fronts are surface boundary that separate different air masses with different characteristics and are associated with sharp changes such as: ~Temperature ~Humidity ~Wind direction• Cold front – in blue, replaces warmer air ahead with the triangle pointing at the direction of the frontal movement• Warm front – in red replaces cooler air ahead with semi-circle pointing at the direction of the frontal direction.• Occluded Front – is when a cold front catches up with a warm front.• Stationary front – a boundary between cool air and warm air with no or little movement.• Ahead of the first three frontal types, warm air is rising to produce clouds and precipitation.• All four fronts can produce a significant amount of precipitation.
Societal Impacts • Cold windy day - Wind Chill - must dress appropriately • Summer day - Proper hydrated or heat exhaustion/stoke • Chinook wind • Long term temperature trends o Cold Spell o Heat waves • Severe T’Storms • Flash Flood - Number one Natural phenomenon causalities • Air Travel o Downburst – destroying crops as well o Wind shear – directional or speed change in the wind field
Societal Impacts of Weather 1/5 Thunderstorms developing along an approaching cold front
Societal Impacts of Weather 2/5 An ice storm causing power outage.
Societal Impacts of Weather 3/5 Tornadoes annually inflict widespread damage and cause the loss of many lives
Societal Impacts of Weather 4/5 Flooding during April 1997, inundates Grand Forks, ND, as flood waters of the Red River extend over much of the city.
Societal Impacts of Weather 5/5 Estimates are that lightening strikes the Earth about 100 times every second (8.64 million strikes per day). About 25 million lightning strikes hit the U.S. every year.