Download
1 / 11
110 likes | 216 Views
Learn how to interpret calibration test results, analyze fire class distribution, performance metrics, and make informed decisions for improvements. Get insights on recent runs and page navigation tips.

E N D
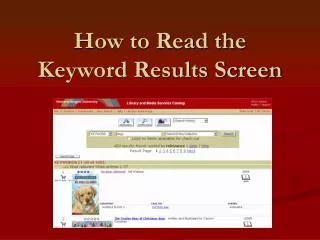
How to read the calibration results A brief guide on how to read the results of the calibration tests.
Recent Runs • The Recent Runs page is intended as a quick view of what is the most recent run for each FPU. • The Run Name and Date should let you know if this is the most recent run, or if this needs to be updated.
Recent Runs • If most recent run is not on the list, let me know
Results Pages • More than one set of results can be kept on a page for comparison purposes. • If you want me to remove old results, let me know. • Output is identified by Run Name
Results Pages Step 1: Look at the Fire Class Distribution. The distribution provides the Historic distribution, the model, or overall distribution of IRS and Large Fire combined, and the contributions from IRS and Large Fire separately. You should look for any classes that are too large, and focus on what impact that could have on the results. Check the number of fires, and ESLs to make sure that fits with what you expected to see. Look for anything that doesn’t seem to fit what you expected.
Results Pages Step 2: Look at the Fire Class Distribution Again. Column R-V shows the number of fires rather than the %. Look at the number of fires where there were larger % differences. How difficult would it be to move those fires? Is it worth it? R6 is the P-value. If this is less than 0.05, the distribution should be fixed. Anything greater than 0.1 is ok, with larger numbers being best. Small differences may not be worth the effort to fix them, or may not be fixable with the current setup (may want to suggest FWA changes for future runs for example).
Results Pages Step 3: Look at the Performance Metrics. Look at the total number of acres burned, and see if it is inside the Historic confidence interval (highlighted in green). Compare the % of burnable acres in the FPU by agency, and the % of burned acres by agency. What could account for the differences, and should they be of concern (FWA design?) Small differences may not be worth the effort to fix them, or may not be fixable with the current setup (may want to suggest FWA changes for future runs for example).
Results Pages Step 3: Look at the Performance Metrics. Look at the total cost, and if it makes sense. Can look at each agency separately, this could also suggest where changes should be made if there is a problem If the total cost isn’t helpful, can look at the average cost per acre to see if that makes sense.
Results Pages • Can these results suggest where to make changes?
Results Pages • Can these results suggest where to make changes?