Download
1 / 20
250 likes | 879 Views
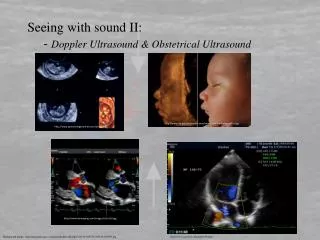
Application of Time-Frequency Analysis : Diagnostic Doppler Ultrasound. Date : 2013/12/12 Reporter : 林宗民. Outline. Basic Concepts Doppler Signal Spectral Doppler Doppler Image(Color Doppler, Power Doppler) Conclusion. Ultrasound. Longitudinal wave Frequency > 20 KHz

E N D
Application of Time-Frequency Analysis :DiagnosticDoppler Ultrasound Date:2013/12/12 Reporter:林宗民
Outline • Basic Concepts • Doppler Signal • Spectral Doppler • Doppler Image(Color Doppler, Power Doppler) • Conclusion
Ultrasound • Longitudinal wave • Frequency > 20 KHz • Diagnosis Ultrasound:1~13 MHz • Velocity : • 343m/s in air • 1540m/s in tissue • 6420m/s in aluminum http://i299.photobucket.com/albums/mm288/wasi142/Biological%20classification/waves.jpg
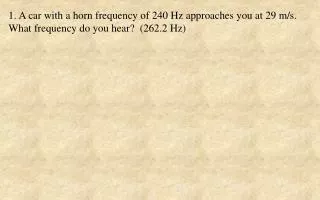
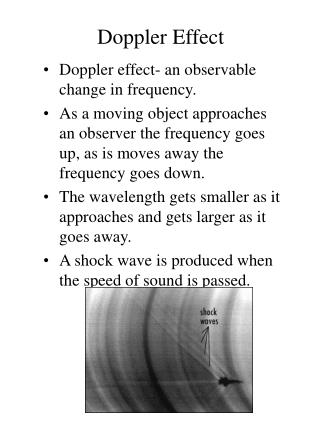
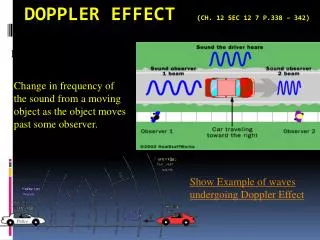
Doppler Effect • Frequency shift due to relative movement. • Doppler frequency:fd = f – f0
Ultrasound Image – B mode • Brightness-mode • Backscattered image • Tomography http://content.answcdn.com/main/content/img/McGrawHill/Encyclopedia/images/CE757525FG0010.gif
Doppler Signal • Doppler Signal, xd(t) = iFT{ fd = fr – ft} • Typically ~kHz in diagnosis Doppler ultrasound.
Doppler Signal Continuous Wave • Transmitting monochromatic wave. Transmitted signal spectrum
Doppler Signal Continuous Wave • Transmitting monochromatic wave. • Received signals from moving tissue plus static tissue. fstatic fmoving Received signal spectrum
Doppler Signal Continuous Wave • Transmitting monochromatic wave. • Received signals from moving tissue plus static tissue. • Demodulation and filtering. fstatic fmoving Doppler signal spectrum
Doppler Signal Continuous Wave • Transmitting monochromatic wave. • Received signals from moving tissue plus static tissue. • Demodulation and filtering. fmoving Doppler signal spectrum
Doppler Signal Pulse Wave • Transmitting several pulses. • Multi-gate sampling.
Doppler Signal Pulse Wave • Transmitting several pulses. • Multi-gate sampling. • Doppler signal
Spectral Doppler (Sonogram) • Continuous wave or Pulse wave • Combining B-mode ultrasound with pulsed wave Doppler • STFT has been commonly used.Unbalanced Sampling with ↑50% overlap. http://en.wikipedia.org/wiki/File:SpectralDopplerA.jpg
Simulation Analysis • Simulated Doppler signal. • Using STFT, Cohen’s class Distribution. • Choi-Williams Distribution • Bessel Distribution • Cone-Shape Distribution
Simulation Analysis Choi-Williams Distribution STFT Bessel Distribution Cone distribution
Simulation Analysis Choi-Williams Distribution STFT Bessel Distribution Cone distribution
Color Doppler • Combining B-mode and Doppler signal. • Pulse Wave Multi-gate system. • Velocity and direction of blood flow are the desire information. • 2 spatial dimension +1 temporal dimension amount computation. • Auto-correlation method for calculating average frequency.
Power Doppler • Combining B-mode and Doppler signal. • Pulse Wave Multi-gate system. • Total power of Doppler signal. • Indicating the flow density information. • Not T-F analysis
Conclusion • Image is 3-D signals. It’s not proper to use T-F analysis. • Spectral Doppler is 1-D signals. T-F analysis has been used to measure the blood flow. • In practice, diagnosis signals are more complex than simulated signals, and more noise. Statistic methods are used.
Reference • “The Difference Between Colour Doppler Velocity Imaging and Power Doppler Imaging,” W. N. McDicken and T. Anderson, Eur J Echocardiography(2002)3,240–244 • “Time-Frequency Analysis for Doppler Ultrasound signals,”陳宗銓, http://djj.ee.ntu.edu.tw/Tutorial_Time-Frequency%20Analysis%20for%20Doppler%20Ultrasound%20Signals.docx. • “Physics and instrumentation of Diagnostic Medical Ultrasound,” PETER FISH, 1990. • “Evaluation of fetal arrhythmias from simultaneous pulsed wave Doppler in pulmonary artery and vein,” Julene S Carvalho, Federico Prefumo, Valentina Ciardelli, ShanthiSairam, AmarnathBhide, Elliot A Shinebourne, 2007. • “The Physical Principles of Doppler and Spectral Analysis,” Peter N. Burns, PhD, J Clin Ultrasound 15567-590. NovemberlDecember1987.