Performance and Characterization of NIRCam Detectors: SFM and LFM Variants Overview
This document presents a detailed analysis of the NIRCam detector behavior following the installation of replacement detectors SFM3, SFM4, LFM3, and LFM4. Key performance parameters are discussed, including linearity, saturation levels, noise characteristics, subarray functions, and the effects of different pixel scales on observations. The data shows significant stability and persistence in detector performance while highlighting the calibration processes undertaken to ensure accuracy. Variations between SW and LW arms are analyzed with respect to acquisition techniques and noise reduction capabilities.


Performance and Characterization of NIRCam Detectors: SFM and LFM Variants Overview
E N D
Presentation Transcript
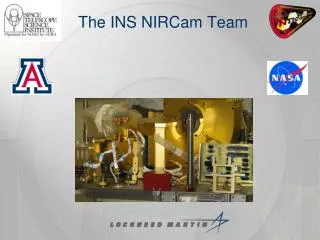
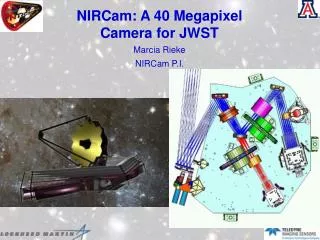
NIRCam Detector Behavior Marcia Rieke
Replacement Detectors Have Been Installed SFM3 SFM4 LFM3 LFM4
Performance Parameters Basic Performance Characteristics Linearity regime Saturation levels Subarray behavior -- timing, performance, size constraints Persistance Stability Jitter tracking SW and LW arms view same patch of sky but with different pixel scales. Two variants on full frame mode: Subarray uses a single output and can be positioned any where. Stripe reads out a number of rows through 4 outputs, restricted to 2048xnrows. NIRCam uses “Sample Up the Ramp” aka Multiaccum but may have co-adds.
QE and Noise QE: (values from Teledyne tests) SW ≥ 0.80 at 2.0 microns LW ≥ 0.80 at 3.5 microns SFM3 SFM4 LFM3 LFM4 16991: 0.80 16989: 0.92 17161: 0.87 17158: 0.83 17005: 0.92 17023: 0.93 17011: 0.95 17024: 0.91 17047: 0.92 17048: 0.88 Total Noise: (values from Arizona tests) Requirement is ≤ 9.0 e- in 1000 secs, all noise sources included SFM3 SFM4 LFM3 LFM4 16991: 5.9e- 16989: 6.0e- 17161: 8.4e- 17158: 7.9e- 17005: 5.7e- 17023: 6.0e- 17011: 6.4e- 17024: 6.4e- 17047: 6.0e- 17048: 5.8e- Correlated Double Sample Noise:(values from Arizona tests) Requirement is ≤ 21 e SFM3 SFM4 LFM3 LFM4 16991: 15.2 e- 16989: 15.1 e- 17161: 15.6e- 17158: 15.2 e- 17005: 14.2 e- 17023: 15.2 e- 17011: 17.8 e- 17024: 18.1 e- 17047: 11.1 e- 17048: 11.7 e-
Sample QE Data From Teledyne SFM3 16991 SFM4 17048 The SW parts shown have the lowest QEs of all the SW parts. LFM3 17161 LFM4 17158
Sample Total Noise Measurements SFM3 17011 SFM4 17023 LFM3 17161 LFM4 17158 Upturn due to light leak Upturn due to light leak Blue = CDS Red = Total Noise
SW Illuminated Images SFM3 SFM4 GL Dewar illumination pattern has not been removed from these images.
LW Illuminated Images LFM3 LFM4 Test dewar illumination pattern has not been removed from these images.
Linearity The unit cell for the H2RG arrays with its source follower circuit is inherently non-linear. We have demonstrated that the non-linearity can be adequately corrected to 90% of full well. The final linearity calibration will be derived from ISIM-level testing using the ASICs.
Well Depths The well depth is required to be greater than 60,000 e- with a detector back bias of 0.25 volts. 90% Fill Well Depths (e-) SFM3 SFM4 16991: 91800 16989: 98800 17005: 99400 17023: 102600 17011: 92900 17024: 93700 17047: 90200 17048: 91000 LFM3 – 17161: 78400 LFM4 – 17158: 76500 From Arizona tests and analysis.
Saturation Levels Saturation levels have been computed for as-built telescope and NIRCam, and assume 80% well fill for LW parts (eg. 60,000 e-). Parameters: Telescope area: 25.37 m2 Telescope reflectivity l>1.6mm: 0.94 Grism throughput: 0.45 Grism R: 1600 Detector QE: 0.85 Fraction of flux in brightest pixel: 0.15 Saturation Limits for 32x2048 Grism Subarray, 32x32 Imaging Subarray How many candidate stars are we likely to miss with these limits?
Subarrays/Stripe Mode • Subarrays need to be sized in 64 pixel increments but can be any rectangular location • Subarrays are read out through a single output amplifier • Stripe mode gives regions of nrowsx2048 pixels through 4 output amplifiers • Timings below are approximate and will include ~0.5% overheads for rolling reset of the rest of the array • Performance is similar to full array (eg. CDS noise) but “reset anomaly” is very apparent
Series of Subarray Dark Ramps Output of a single pixel in a 160x160 subarray with 20-samples per ramp. Reset behavior will be different with ASIC readout (and will be checked during Thermal-Vac). Baseline varies due to kTC noise (~35 electrons).
Latent Images We have taken data to allow a calibration of the form below where the two time constants are ~60 seconds and ~1000 seconds. Our latent data were taken using flood illumination (have a check that point source illumination produces the same result). Acquisition started from having the array in the dark followed by illumination, followed by 4000 secs of dark. Rapid illumination produces smaller latents than slow illumination. Latents are smaller in 5-micron cut-off arrays than in the 2.5 micron devices. Rate Dependence Well Fill Dependence
First Look at Stability • 100 ramps with 20 full frame reads each were acquired (one ramp collected ~40000e- each, 4x10⁶ for entire set) • Set-up used Leach electronics • Well fill for data shown was ~40% • 1.7 micron LED provided flood illumination • All four arrays comprising a short wavelength focal plane were illuminated simultaneously • Slopes were fit to each ramp • Clear evidence of LED out drift seen • Ratio variablility suggests that the noise is dominated by photon statistics (more careful analysis needed) • Special test will be executed during ISIM thermal-vac to look at this using ASICs
Jitter Tracking If desirable, the short wavelength arm could be used to observe the target star simultaneously with a grism or filter in the long wavelength arm. Use of a 1% filter and/or weak lenses to spread out the light would likely be required. There may also be operational constraints on the shape of the region to be readout (might have to be the same size as the LW subarray). A 32x2048 subarray would give pointing information every 1.31 to 1.98 seconds. Is this mode worth pursuing? And a corollary, should we measure in SW and LW arms simultaneously? +4 Waves Weak Lens Image Rectangle is 32 pixels wide
Other Issues • Adjacent pixels are not completely independent of each other – they are capacitatively coupled at the 0.5-1% level. Called “IPC”, Interpixel Capacitance Illustrated using a hot pixel. • Arrays have “Random Telegraph Noise” (popcorn noise) • Pixel will spontaneously jump in its DC-Level, may return to baseline even within same ramp • Quoted noise includes the effect • Is a rare occurrance, need to analyze existing data to check whether some pixels are “repeaters”, measure rates • NIRCam is close to properly sampled spatially but still will be vulnerable to small amounts of “missing” charge due to centration
16989 Illuminated Dark
16989 Latent Images Latent Map
16991 Illuminated Dark
16991 Latent Images Latent Map
17005 Dark Illuminated
17005 Latent Images Latent Map
17011 Illuminated Dark
17011 Latent Images Latent Map
17023 Illuminated Dark
17023 Latent Images Latent Map
17047 Illuminated Dark
17047 Latent Images Latent Map
17024 Illuminated Dark
17024 Latent Images Latent Map
17161 = Long Wavelength Replacement #1 (LFM3) Dark Illuminated
17158 = Long Wavelength Replacement #2 (LFM4) Dark Illuminated