Download
1 / 61
610 likes | 764 Views
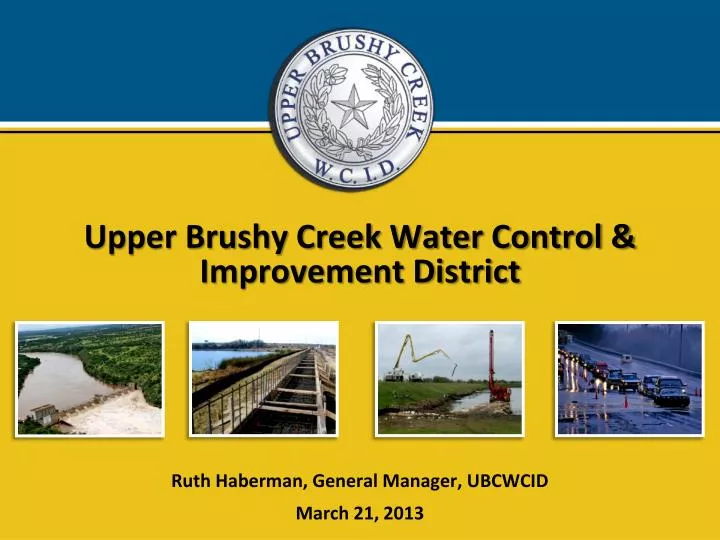
Upper Brushy Creek Water Control & Improvement District. Ruth Haberman , General Manager, UBCWCID March 21, 2013. DISTRICT OVERVIEW. Original District was formed by the Texas Legislature in 1956 for flood and erosion control within the Brushy Creek watershed

E N D
Upper Brushy Creek Water Control & Improvement District Ruth Haberman, General Manager, UBCWCID March 21, 2013
DISTRICT OVERVIEW • Original District was formed by the Texas Legislature in 1956 for flood and erosion control within the Brushy Creek watershed • Primary focus has been operation and maintenance of 23 dams constructed by the SCS (now NRCS) in the 1950s and 1960s
DAM MODERNIZATION DAM 11 Since 2003, over $15M in tax revenue have been spent to modernize 21 dams. DAM 14 Two dams remain to be modernized; Dams 7 and 8.
MISSION STATEMENT The mission of the Upper Brushy Creek Water Control and Improvement District is to maintain and improve flood control structures and take appropriate measures to protect public safety as well as economic infrastructure of the District, in consultation and cooperation with other governmental entities. The District will actively foster a regional perspective and will encourage cooperation among governmental entities. We will accomplish these tasks utilizing cost-effective methods, minimizing the impact to the environment, considering the community values of our stakeholders, and conducting our business with openness, honesty and integrity.
FLOODING ISSUES IN THE DISTRICT Tropical Storm Hermine Even with the dams operating as expected, there were still threats to public safety and risk of property damage. District Infrastructure: • The dams functioned as designed, constructed and maintained. • The dams experienced only minor damage from the flooding. • The web-based Flood Monitoring System allowed District engineers, elected officials, and both City and County emergency managers to monitor the rainfall in the area.
UPPER BRUSHY CREEK WATERSHED STUDY • Purpose: • Analyze watershed hydrology and hydraulics. • Identify potential flood hazard areas. • Propose alternative solutions for regional flood hazard mitigation. • Provide final report, models and documentation to all participants. • Coordinate with FEMA and local government entities to incorporate study results into new regulatory FEMA Risk Maps (floodplain maps) for the entire watershed.
Upper Brushy Creek Hydrologic Model Jeff Irvin, URS
Hydrology: the Mindset Hydrology = Data (Rainfall, Runoff, Land Use) Data bad = Hydrology bad Data good = Hydrology good How do you test data?
Hydrology: the Mindset The data test: Representative? in place (where data taken) in time period (same as application time period) in amount of data? Homogeneous? – applied on any data to be aggregated/ averaged in place in time in collection method and accuracy
Hydrology: the Mindset The most representative and homogeneous data set is the best data set
Hydrologic Model Calibration Data • Rainfall • Sources of rainfall data? • Which storms? • Runoff (flow or stage plus hydraulics) • Sources?
Choice of Calibration storms The runoff hydrograph has two main parameters that define shape: • A parameter that defines how much rain runs off (runoff volume) • A parameter that defines time of peak (runoff temporal shape)
Choice of Calibration Storms Runoff volume (for a given rainfall) is a function of:
Choice of Calibration Storms Runoff volume (for a given rainfall) is a function of: • Rainfall • Land Use • Soil Type • % Impervious • Antecedent Runoff Condition
Choice of Calibration Storms What are data validity tests for a calibration storm used to calibrate a model rainfall/runoff relationship? • Rainfall
Choice of Calibration Storms What are data validity tests for a calibration storm for a model rainfall/runoff relationship? • Rainfall • Representative • In location and time • In temporal shape • In size • Are there enough data? • Spatially vs storm shape • Temporally versus storm shape
Choice of Calibration Storms Representative in location and time? Are there enough data? • Spatially vs storm shape
Choice of Calibration Storms Are there enough data? • Spatially vs storm shape
Choice of Calibration Storms Are there enough data? • Temporally versus storm shape
Choice of Calibration Storms Representative? • In temporal shape
Why are results inconsistent? Can we compare 2007 storm runoff results to 2012 storm runoff results? Are the conditions that affect runoff homogeneous between the two storms? Rainfall Land Use Soil Type % Impervious Antecedent Runoff Condition
Antecedent Runoff Are the two storms homogeneous in terms of antecedent conditions? 2007 Rainfall 2010 Rainfall
Upper Brushy Creek Water Control and Improvement District Dam 7 Modernization CE 374K Hydrology Dustin Mortensen, Freese and Nichols March 21, 2013
FNI OVERVIEW • Multi-service engineering,architectureandenvironmentalsciencefirm • 118-yearhistory • 520+employees across14 offices throughout Texas • Client satisfaction is ourtop priority • We offer cost-effectivesolutions
Dam 7OVERVIEW • Intermediate Sized, High Hazard • Completed in 1965 • Hydraulic Capacity - Passes 46% PMF • Drawdown Time (Auxiliary Spillway-Normal Pool)
Spillway Hydraulics Spillway discharge is calculated using weir equation Where: Q= discharge (cfs or m3/s) C=Discharge coefficient L=Length of the “lip” over which the water flows H=Head above the weir
Increase Capacity Existing dam
Increase H Raising the dam
Increase L Widening the spillway
Increase L and H Range of options…
Labyrinth Weir • Increases L without increases spillway footprint width • Dam 7 alternative has 1,800 feet of weir in 300 foot wide footprint • C is dependent on wall angles, wall height, head and crest shape