Download
1 / 19
190 likes | 304 Views
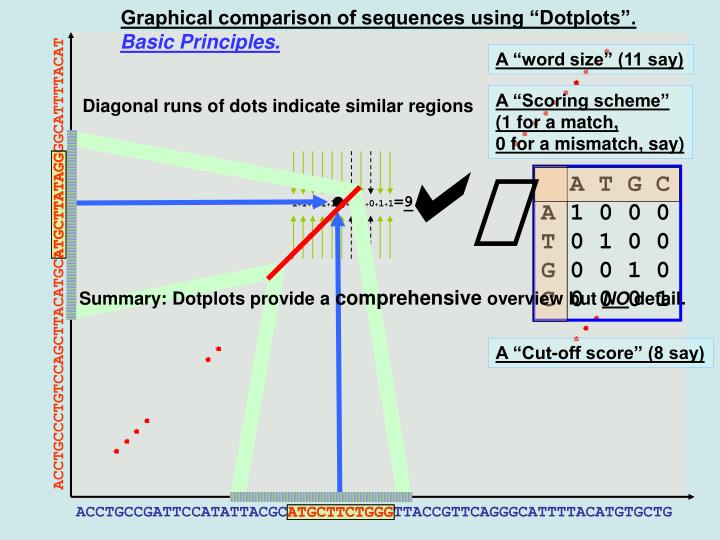
ATGCTTATAGG. A T G C A 1 0 0 0 T 0 1 0 0 G 0 0 1 0 C 0 0 0 1. ATGCTTCTGGG. Graphical comparison of sequences using “Dotplots”. Basic Principles. A “word size” (11 say). A “Scoring scheme” (1 for a match, 0 for a mismatch, say). Diagonal runs of dots indicate similar regions. a. l.

E N D
ATGCTTATAGG A T G C A 1 0 0 0 T 0 1 0 0 G 0 0 1 0 C 0 0 0 1 ATGCTTCTGGG Graphical comparison of sequences using “Dotplots”. Basic Principles. A “word size” (11 say) A “Scoring scheme” (1 for a match, 0 for a mismatch, say) Diagonal runs of dots indicate similar regions a l 1+1+1+1+1+1+0+1+0+1+1=9 ACCTGCCCTGTCCAGCTTACATGCATGCTTATAGGGGCATTTTACAT Summary: Dotplots provide a comprehensive overview but NO detail. A “Cut-off score” (8 say) ACCTGCCGATTCCATATTACGCATGCTTCTGGGTTACCGTTCAGGGCATTTTACATGTGCTG
A T G C A 5 -4 -4 -4 T -4 5 -4 -4 G -4 -4 5 -4 C -4 -4 -4 5 A T G C A 1 0 0 0 T 0 1 0 0 G 0 0 1 0 C 0 0 0 1 Graphical comparison of sequences using “Dotplots”. Scoring Schemes. DNA: Simplest Scheme is the Identity Matrix. More complex matrices can be used. For example, the default EMBOSS DNA scoring matrix is: The use of negative numbers is only pertinent when these matrices are use for computing textual alignments. Using a wider spread of scores eases the Expansion of the scoring matrix to sensibly include ambiguity codes.
A B C D E F G H I K L M N P Q R S T V W Y Z A 2 0 -2 0 0 -4 1 -1 -1 -1 -2 -1 0 1 0 -2 1 1 0 -6 -3 0 B 0 2 -4 3 2 -5 0 1 -2 1 -3 -2 2 -1 1 -1 0 0 -2 -5 -3 2 C -2 -4 12 -5 -5 -4 -3 -3 -2 -5 -6 -5 -4 -3 -5 -4 0 -2 -2 -8 0 -5 D 0 3 -5 4 3 -6 1 1 -2 0 -4 -3 2 -1 2 -1 0 0 -2 -7 -4 3 E 0 2 -5 3 4 -5 0 1 -2 0 -3 -2 1 -1 2 -1 0 0 -2 -7 -4 3 F -4 -5 -4 -6 -5 9 -5 -2 1 -5 2 0 -4 -5 -5 -4 -3 -3 -1 0 7 -5 G 1 0 -3 1 0 -5 5 -2 -3 -2 -4 -3 0 -1 -1 -3 1 0 -1 -7 -6 -1 H -1 1 -3 1 1 -2 -2 6 -2 0 -2 -2 2 0 3 2 -1 -1 -2 -3 0 2 I -1 -2 -2 -2 -2 1 -3 -2 5 -2 2 2 -2 -2 -2 -2 -1 0 4 -5 -1 -2 K -1 1 -5 0 0 -5 -2 0 -2 5 -3 0 1 -1 1 3 0 0 -2 -3 -4 0 L -2 -3 -6 -4 -3 2 -4 -2 2 -3 6 4 -3 -3 -2 -3 -3 -2 2 -2 -1 -3 M -1 -2 -5 -3 -2 0 -3 -2 2 0 4 6 -2 -2 -1 0 -2 -1 2 -4 -2 -2 N 0 2 -4 2 1 -4 0 2 -2 1 -3 -2 2 -1 1 0 1 0 -2 -4 -2 1 P 1 -1 -3 -1 -1 -5 -1 0 -2 -1 -3 -2 -1 6 0 0 1 0 -1 -6 -5 0 Q 0 1 -5 2 2 -5 -1 3 -2 1 -2 -1 1 0 4 1 -1 -1 -2 -5 -4 3 R -2 -1 -4 -1 -1 -4 -3 2 -2 3 -3 0 0 0 1 6 0 -1 -2 2 -4 0 S 1 0 0 0 0 -3 1 -1 -1 0 -3 -2 1 1 -1 0 2 1 -1 -2 -3 0 T 1 0 -2 0 0 -3 0 -1 0 0 -2 -1 0 0 -1 -1 1 3 0 -5 -3 -1 V 0 -2 -2 -2 -2 -1 -1 -2 4 -2 2 2 -2 -1 -2 -2 -1 0 4 -6 -2 -2 W -6 -5 -8 -7 -7 0 -7 -3 -5 -3 -2 -4 -4 -6 -5 2 -2 -5 -6 17 0 -6 Y -3 -3 0 -4 -4 7 -5 0 -1 -4 -1 -2 -2 -5 -4 -4 -3 -3 -2 0 10 -4 Z 0 2 -5 3 3 -5 -1 2 -2 0 -3 -2 1 0 3 0 0 -1 -2 -6 -4 3 A C G T S W R Y K M B V H D N U A 5 -4 -4 -4 -4 1 1 -4 -4 1 -4 -1 -1 -1 -2 -4 C -4 5 -4 -4 -4 1 -4 1 1 -4 -1 -4 -1 -1 -2 5 G -4 -4 5 -4 1 -4 1 -4 1 -4 -1 -1 -4 -1 -2 -4 T -4 -4 -4 5 1 -4 -4 1 -4 1 -1 -1 -1 -4 -2 -4 S -4 -4 1 1 -1 -4 -2 -2 -2 -2 -1 -1 -3 -3 -1 -4 W 1 1 -4 -4 -4 -1 -2 -2 -2 -2 -3 -3 -1 -1 -1 1 R 1 -4 1 -4 -2 -2 -1 -4 -2 -2 -3 -1 -3 -1 -1 -4 Y -4 -1 -4 1 -2 -2 -4 -1 -2 -2 -1 -3 -1 -3 -1 1 K -4 1 1 -4 -2 -2 -2 -2 -1 -4 -1 -3 -3 -1 -1 1 M 1 -4 -4 1 -2 -2 -2 -2 -4 -1 -3 -1 -1 -3 -1 -4 B -4 -1 -1 -1 -1 -3 -3 -1 -1 -3 -1 -2 -2 -2 -1 -1 V -1 -4 -1 -1 -1 -3 -1 -3 -3 -1 -2 -1 -2 -2 -1 -4 H -1 -1 -4 -1 -3 -1 -3 -1 -3 -1 -2 -2 -1 -2 -1 -1 D -1 -1 -1 -4 -3 -1 -1 -3 -1 -3 -2 -2 -2 -1 -1 -1 N -2 -2 -2 -2 -1 -1 -1 -1 -1 -1 -1 -1 -1 -1 -1 -2 U -4 5 -4 -4 -4 1 -4 1 1 -4 -1 -4 -1 -1 -2 5 IUB DNA Alphabet CodeMeaning A C G T/U M `aMino` A|C R `puRine` A|G W `Weak` A|T S `Strong` C|G Y `pYrimidine` C|T K `Keto` G|T V `not T` A|C|G H `not G` A|C|T D `not C` A|G|T B `not A` C|G|T N `aNy` A|C|G|T Graphical comparison of sequences using “Dotplots”. Scoring Schemes. Using a wider spread of scores eases the expansion of the scoring matrix to sensibly include ambiguity codes. For Protein sequence dotplots more complex scoring schemes are required. Scores must reflect far more than alphabetic identity.
ATGCTTATAGG ATGCTTATAGG A T G C A 1 0 0 0 T 0 1 0 0 G 0 0 1 0 C 0 0 0 1 ATGCTTCTGGG ATGCTTCTGGG Graphical comparison of sequences using “Dotplots”. Faster plots for perfect matches. To detect perfectly matching words, a dotplot program has a choice of strategies 1) Select a scoring scheme and a word size (11, say) For every pair of words, compute a word match score in the normal way l Only if the maximum possible cut-off score (11) is achieved If the maximum possible cut-off score (still 11) is not achieved a r 1+1+1+1+1+1+1+1+1+1+1=11 1+1+1+1+1+1+0+1+0+1+1=9 Celebrate with a dot Do not celebrate with a dot
ATGCTTATAGG ATGCTTATAGG ATGCTTCTGGG ATGCTTCTGGG Graphical comparison of sequences using “Dotplots”. Faster plots for perfect matches. To detect perfectly matching words, a dotplot program has a choice of strategies OR 2) For every pair of words, ……… see if the letters are exactly the same l If they are not If they are a r aaaaaaaaaaa aaaaaararaa Celebrate with a dot Do not celebrate with a dot To detect exactly matching words, fast character string matching canreplace laboriouscomputation of match scores to be compared with a cut-off score Many packages include a dotplot option specifically for detecting exactly matching words. Particular advantage when seeking strong matches in long DNA sequences.
Graphical comparison of sequences using “Dotplots”. Dotplot parameters. There are three parameters to consider for a dotplot: • The scoring scheme. • The cut-off score • The word size
Graphical comparison of sequences using “Dotplots”. Dotplot parameters. The Scoring scheme. DNA Usually, DNA Scoring schemes award a fixed reward for each matched pair of bases and a fixed penalty for each mismatched pair of bases. Choosing between such scoring schemes will affect only the choice of a sensible cut-off score and the way ambiguity codes are treated. Protein Protein scoring schemes differ in the evolution distance assumed between the proteins being compared. The choice is rarely crucial for dotplot programs.
Graphical comparison of sequences using “Dotplots”. Dotplot parameters. The Cut-off score. The higher the cut-off score the less dots will be plotted. But, each dot is more likely to be significant. The lower the cut-off score the more dots will be plotted. But, dots are more likely to indicate a chance match (noise).
Graphical comparison of sequences using “Dotplots”. Dotplot parameters. The Cut-off score. 30 20 5 10 Scoring Scheme: PAM 250, Word Size: 25,Cut-off score: More “features”, probably noise, appear obscuring the original 4 clear regions. 4 regions become clearer, some other weaker features appear Cut-off now clearly too low. Too much noise to see interesting regions. 4 clear strong regions apparent
Graphical comparison of sequences using “Dotplots”. The Word size. Dotplot parameters. Smaller words pick up smaller features. Large words can miss small matches. The smallest “features” are often just “noise”.
Graphical comparison of sequences using “Dotplots”. The Word size. Dotplot parameters. For sequences with regions of small matching features. Small words pick small features Individually. Larger words show matching regions more clearly. The lack of detail can be an advantage
Graphical comparison of sequences using “Dotplots”. The Word size. Dotplot parameters. Displaying the word 11 plot alone shows that major features are drawn in more “carefully”. Arguably, less usefully if a broad overview is the objective. Superimposing a plot with a smaller word size of 11 shows the emergence of extra dots. In this case probably all noise. Using a relatively large word size of 25, features are drawn with a broad brush. Detail can be missed
Graphical comparison of sequences using “Dotplots”. Detection of Repeats Other uses of dotplots.
Graphical comparison of sequences using “Dotplots”. Detection of Repeats Other uses of dotplots.
Graphical comparison of sequences using “Dotplots”. Detection of Repeats Other uses of dotplots.
Graphical comparison of sequences using “Dotplots”. Detection of Repeats Other uses of dotplots.
Graphical comparison of sequences using “Dotplots”. Detection of Stem Loops Other uses of dotplots.
Graphical comparison of sequences using “Dotplots”. Detection of Stem Loops Other uses of dotplots.