Download
1 / 23
230 likes | 252 Views
Explore growth, distribution, and size of Hispanic-owned businesses in the U.S. in 1997, including comparisons with other firms. Learn about improvements made for inclusive estimates this year.

E N D
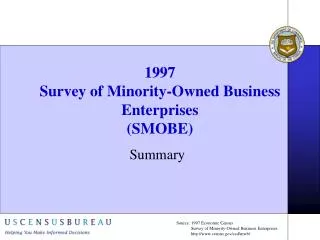
1997Survey of Minority-Owned Business Enterprises Hispanic Source: 1997 Economic Census Survey of Minority-Owned Business Enterprises http://www.census.gov/csd/mwb/
SMOBE OVERVIEW Source: 1997 Economic Census Survey of Minority-Owned Business Enterprises http://www.census.gov/csd/mwb/
HISTORY Source: 1997 Economic Census Survey of Minority-Owned Business Enterprises http://www.census.gov/csd/mwb/
SCOPE AND COVERAGE Source: 1997 Economic Census Survey of Minority-Owned Business Enterprises http://www.census.gov/csd/mwb/
SCOPE AND COVERAGE Source: 1997 Economic Census Survey of Minority-Owned Business Enterprises http://www.census.gov/csd/mwb/
SCOPE AND COVERAGE Source: 1997 Economic Census Survey of Minority-Owned Business Enterprises http://www.census.gov/csd/mwb/
PUBLICATIONS Source: 1997 Economic Census Survey of Minority-Owned Business Enterprises http://www.census.gov/csd/mwb/
IMPROVEMENTS FOR 1997 Source: 1997 Economic Census Survey of Minority-Owned Business Enterprises http://www.census.gov/csd/mwb/
IMPROVEMENTS FOR 1997 • Fully inclusive estimates • In reports prior to 1997, estimates for minority-owned business enterprises for a part of the sample could not be allocated by industry and geography and were, therefore, not included in the detailed tables of the reports. • For 1997, the estimates for all levels of the data include all firms owned by the race and ethnic groups presented. Source: 1997 Economic Census Survey of Minority-Owned Business Enterprises http://www.census.gov/csd/mwb/
IMPROVEMENTS FOR 1997 Source: 1997 Economic Census Survey of Minority-Owned Business Enterprises http://www.census.gov/csd/mwb/
Growth of Hispanic-Owned Firms Source: 1997 Economic Census Survey of Minority-Owned Business Enterprises http://www.census.gov/csd/mwb/
Source: 1997 Economic Census Survey of Minority-Owned Business Enterprises http://www.census.gov/csd/mwb/
Percent Distribution of All U.S. Firms by Industry Division: 1997 Source: 1997 Economic Census Survey of Minority-Owned Business Enterprises http://www.census.gov/csd/mwb/
Percent Distribution of Hispanic-Owned Firms by Industry Division: 1997 Source: 1997 Economic Census Survey of Minority-Owned Business Enterprises http://www.census.gov/csd/mwb/
Source: 1997 Economic Census Survey of Minority-Owned Business Enterprises http://www.census.gov/csd/mwb/
Average Receipts per Firm by Industry Division for Hispanic-Owned Firms Compared to All U.S. Firms: 1997 (Thousands of dollars) Source: 1997 Economic Census Survey of Minority-Owned Business Enterprises http://www.census.gov/csd/mwb/
Hispanic-Owned Firms and Receipts as a Percent of All U.S. Firms and Receipts by Industry Division: 1997 Source: 1997 Economic Census Survey of Minority-Owned Business Enterprises http://www.census.gov/csd/mwb/
Five States With Largest Number of Hispanic-Owned Firms • California - 336,405 • Texas - 240,396 • Florida - 193,902 • New York - 104,189 • New Jersey - 36,116 Source: 1997 Economic Census Survey of Minority-Owned Business Enterprises http://www.census.gov/csd/mwb/
Five MAs With Largest Number of Hispanic-Owned Firms • Los Angeles, CA - 136,678 • Miami, FL - 120,605 • New York, NY - 84,880 • Houston, TX - 41,769 • San Antonio, TX - 34,834 Source: 1997 Economic Census Survey of Minority-Owned Business Enterprises http://www.census.gov/csd/mwb/
Size of Hispanic-Owned Firms With Paid Employees Source: 1997 Economic Census Survey of Minority-Owned Business Enterprises http://www.census.gov/csd/mwb/
Size of Hispanic-Owned Firms • Of all 1,199,896 Hispanic-owned firms, 26,666 (2%) had more than $1,000,000 in receipts. • 263,071 (22%) had less than $5,000 in receipts. Source: 1997 Economic Census Survey of Minority-Owned Business Enterprises http://www.census.gov/csd/mwb/
Legal Form of Organization Source: 1997 Economic Census Survey of Minority-Owned Business Enterprises http://www.census.gov/csd/mwb/
For More Information Source: 1997 Economic Census Survey of Minority-Owned Business Enterprises http://www.census.gov/csd/mwb/