Download
1 / 35
350 likes | 353 Views
The Sloan Digital Sky Survey aims to create a detailed, multicolor map of the Northern Sky over 5 years. With a budget of approximately $80M, the project strives to study the distribution of galaxies, measure the global properties of the Universe, conduct a local census of the galaxy population, and find the most distant objects in the Universe.

E N D
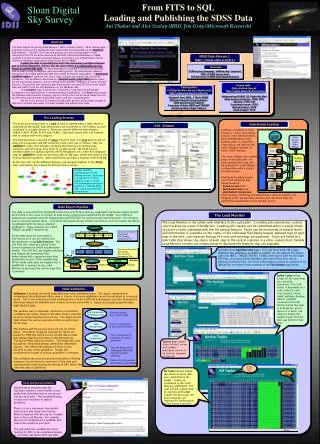
The Sloan Digital Sky Survey Archive Alex Szalay Ani ThakarPeter Kunszt Blair LanierSteve KentJim Gray Don Slutz The Johns Hopkins University, Microsoft BARC, SDSS Collaboration
A project run by the Astrophysical Research Consortium (ARC) The University of Chicago Princeton University The Johns Hopkins University The University of Washington Fermi National Accelerator Laboratory US Naval Observatory The Japanese Participation Group The Institute for Advanced Study Max Planck Inst, Heidelberg SLOAN Foundation, NSF, DOE, NASA Goal: To create a detailed multicolor map of the Northern Sky over 5 years, with a budget of approximately $80M Data Size: 40 TB raw, 2 TB processed Computing Continuum Conference, March 15-17, 2000
Scientific Motivation Create the ultimate map of the Universe: The Cosmic Genome Project! Study the distribution of galaxies: What is the origin of fluctuations? What is the topology of the distribution? Measure the global properties of the Universe: How much dark matter is there? Local census of the galaxy population: How did galaxies form? Find the most distant objects in the Universe: What are the highest quasar redshifts? Computing Continuum Conference, March 15-17, 2000
daCosta etal 1995 SDSS Collaboration 2002 deLapparent, Geller and Huchra 1986 Gregory and Thompson 1978 The Cosmic Genome Project The SDSS will create the ultimate mapof the Universe, with much more detailthan any other measurement before Computing Continuum Conference, March 15-17, 2000
Area and Size of Redshift Surveys Computing Continuum Conference, March 15-17, 2000
Features of the SDSS Special 2.5m telescope, located at Apache Point, NM 3 degree field of view. Zero distortion focal plane. Two surveys in one: Photometric survey in 5 bands. Spectroscopic redshift survey. Huge CCD Mosaic 30 CCDs 2K x 2K (imaging) 22 CCDs 2K x 400 (astrometry) Two high resolution spectrographs 2 x 320 fibers, with 3 arcsec diameter. R=2000 resolution with 4096 pixels. Spectral coverage from 3900Å to 9200Å. Automated data reduction Over 100 man-years of development effort. (Fermilab + collaboration scientists) Very high data volume Expect over 40 TB of raw data. About 2 TB processed products Data made available to the public Computing Continuum Conference, March 15-17, 2000
Apache Point Observatory Located in New Mexico, near White Sands National Monument Computing Continuum Conference, March 15-17, 2000
The Telescope Special 2.5m telescope 3 degree field of view Zero distortion focal plane Wind screen moved separately Computing Continuum Conference, March 15-17, 2000
The Photometric Survey Northern Galactic Cap 5 broad-band filters ( u', g', r', i', z’ ) limiting magnitudes (22.3, 23.3, 23.1, 22.3, 20.8) drift scan of 10,000 square degrees 55 sec exposure time 40 TB raw imaging data -> pipeline -> 100,000,000 galaxies 50,000,000 stars calibration to 2% at r'=19.8 only done in the best seeing (20 nights/yr) pixel size is 0.4 arcsec, astrometric precision is 60 milliarcsec Southern Galactic Cap multiple scans (> 30 times) of the same stripe Continuous data rate of 8 Mbytes/sec Computing Continuum Conference, March 15-17, 2000
Survey Strategy Overlapping 2.5 degree wide stripes Avoiding the Galactic Plane (dust) Multiple exposures on the three Southern stripes Computing Continuum Conference, March 15-17, 2000
The Spectroscopic Survey Measure redshifts of objects distance SDSS Redshift Survey: 1 million galaxies 100,000 quasars 100,000 stars Two high throughput spectrographs spectral range 3900-9200 Å. 640 spectra simultaneously. R=2000 resolution. Automated reduction of spectra Very high sampling density and completeness Objects in other catalogs also targeted Computing Continuum Conference, March 15-17, 2000
The Mosaic Camera Computing Continuum Conference, March 15-17, 2000
Photometric Calibrations • The SDSS will create a new photometric system: • u' g' r' i' z' • Primary standards: observed with the USNO 40-inch telescope in Flagstaff • Secondary standards:observed with the SDSS 20-inch telescope at Apache Point – calibrating the SDSS imaging data Computing Continuum Conference, March 15-17, 2000
The Spectrographs Two double spectrographs very high throughput two 2048x2048 CCD detectors mounted on the telescope light fed through slithead Computing Continuum Conference, March 15-17, 2000
The Fiber Feed System Galaxy images are captured by optical fibers lined up on the spectrograph slit Manually plugged during the day into Al plugboards 640 fibers in each bundle The largest fiber system today Computing Continuum Conference, March 15-17, 2000
First Light Images Telescope: First light May 9th 1998 Equatorial scans Computing Continuum Conference, March 15-17, 2000
The First Stripes Camera: 5 color imaging of >100 square degrees Multiple scans across the same fields Photometric limits as expected Computing Continuum Conference, March 15-17, 2000
NGC 2068 Computing Continuum Conference, March 15-17, 2000
UGC 3214 Computing Continuum Conference, March 15-17, 2000
NGC 6070 Computing Continuum Conference, March 15-17, 2000
The First Quasars The four highest redshift quasars have been found in the first SDSS test data ! Computing Continuum Conference, March 15-17, 2000
SDSS T-dwarf (June 1999) Methane/T Dwarf Discovery of several newobjects by SDSS & 2MASS Computing Continuum Conference, March 15-17, 2000
SDSS Data Flow Computing Continuum Conference, March 15-17, 2000
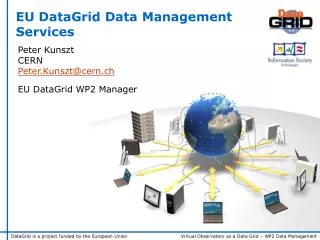
Distributed Collaboration Fermilab U.Chicago U.Washington ESNET I. AdvancedStudy Japan Princeton U. VBNS JHU Apache PointObservatory NMSU USNO Computing Continuum Conference, March 15-17, 2000
Data Processing Pipelines Computing Continuum Conference, March 15-17, 2000
SDSS Data Products Object catalog 400 GB parameters of >108 objects Redshift Catalog 1 GB parameters of 106 objects Atlas Images 1.5 TB 5 color cutouts of >108 objects Spectra 60 GB in a one-dimensional form Derived Catalogs 20 GB - clusters - QSO absorption lines 4x4 Pixel All-Sky Map 60 GB heavily compressed All raw data saved in a tape vault at Fermilab Computing Continuum Conference, March 15-17, 2000
Who will be using the archive? Power Userssophisticated, with lots of resources research is centered around the archive datamoderate number of very intensive queries mostly statistical, large output sizes General Astronomy Public frequent, but casual lookup of objects/regions the archives help their research, but not central to itlarge number of small queries a lot of cross-identification requests Wide Publicbrowsing a ‘Virtual Telescope’ can have large public appeal need special packagingcould be a very large number of requests Computing Continuum Conference, March 15-17, 2000
Attributes Number Sky Position 3 Multiband Fluxes N = 5+ Other M= 100+ Geometric Indexing “Divide and Conquer” Partitioning 3NM HierarchicalTriangular Mesh Split as k-d treeStored as r-treeof bounding boxes Using regularindexing techniques Computing Continuum Conference, March 15-17, 2000
Distributed Implementation User Interface Analysis Engine Master SX Engine Objectivity Federation Objectivity Slave Slave Slave Objectivity Slave Objectivity Objectivity RAID Objectivity RAID RAID RAID Computing Continuum Conference, March 15-17, 2000
Processing Platforms Archive at Fermilab: 2 AlphaServer 8200 data processing 1 SGI Origin 2000 data bases Archive at JHU: 1 AlphaServer 1000A (development) 10 Intel based servers w. LVD RAID - Intel T4E2K software verified on Digital Unix, IRIX, Solaris, Linux Alternative implementation on MS SQL Server Computing Continuum Conference, March 15-17, 2000
Trends • Future dominated by detector improvements • Moore’s Law growth in CCD capabilities • Gigapixel arrays on the horizon • Improvements in computing and storage will track growth in data volume • Investment in software is critical, and growing Total area of 3m+ telescopes in the world in m2, total number of CCD pixels in Megapix, as a function of time. Growth over 25 years is a factor of 30 in glass, 3000 in pixels. Computing Continuum Conference, March 15-17, 2000
The Age of Mega-Surveys The next generation of astronomical archives with Terabyte catalogs will dramatically change astronomy top-down design large sky coverage built on sound statistical plans uniform, homogeneous, well calibrated well controlled and documented systematics The technology to acquire, store and index the data is here we are riding Moore’s Law Data mining in such vast archives will be a challenge, but possibilities are quite unimaginable Integrating these archives into a single entity is a project for the whole community=> National Virtual Observatory Computing Continuum Conference, March 15-17, 2000
NVO: The Challenges Size of the archived data • 40,000 square degrees is 2 trillion pixels • One band: 4 Terabytes • Multi-wavelength: 10-100 Terabytes • Time dimension: few Petabytes The development of • new archival methods • new analysis tools • new standards (metadata, interchange formats) Hardware/networking requirements Training the next generation! Computing Continuum Conference, March 15-17, 2000
Summary The SDSS project combines astronomy, physics, and computer science It promises to fundamentally change our view of the universe It will determine how the largest structures in the universe were formed It will serve as the standard astronomy reference for several decades Its ‘virtual universe’ can be explored by both scientists and the public Through its archive it will create a new paradigm in astronomy Computing Continuum Conference, March 15-17, 2000
www.sdss.org www.sdss.jhu.edu Computing Continuum Conference, March 15-17, 2000