Download
1 / 36
360 likes | 408 Views
Explore various indicators of development, poverty cycles, single and composite indicators, and how to measure poverty. Learn about GDP, health measures, education indicators, and the Human Development Index (HDI).

E N D
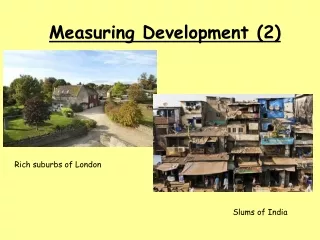
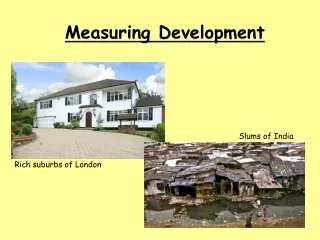
Measuring DevelopmentChapter 28 Presented by: MattayBotcheff
Overview Poverty trap/poverty cycles Single indicators Composite indicators Other indicators of development
Poverty Trap/Poverty Cycles • Poverty measured in two ways • Relative poverty – • comparative level of poverty • for example, earning below a certain percentage of average income within the country • Absolute poverty – • basic necessities for survival (basic clothing, food and shelter) • PPP $1.25 per day (World Bank) – extreme poverty • PPP $2.00 per day – moderate poverty • 50 – 90% of population below extreme or moderate poverty lines (Mali, Niger, Nigeria, Zambia, CAR) • Barriers to economic growth and development • Connected • Self-perpetuating • Poverty cycles = Development Traps
Single Indicators Financial measures Health measures Education measures
Financial Measures • GDP per capita • total output within the country divided by population • Income of foreign companies operating within the country is included • Income of national companies operating abroad is NOT included • GNI per capita • Total income earned by a country’s factors of production (regardless of their location) divided by the population • Income of foreign companies operating within the country is NOT included • Income of national companies operating abroad is included • FDI trends • FDI flows to developing countries – from $257 bil. (2000) to $621 bil. (2008) • Large FDI means GDP > GNI (e.g. profits would eventually be repatriated) • Worker remittances (India, Mexico) – significant inflow of money from abroad • GDP per capita at PPP
Purchasing Power Parity (PPP) • Value of GDP in other countries • Useful in making comparisons between countries • Use common currency for comparison • National currencies change in value • Goods and services cost different amounts in different countries • PPP equates the purchasing power of currencies in different countries • Calculated by the World Bank • The Big Mac index • calculated by the Economist
Health Measures • Life expectancy at birth • The average number of years that a person may expect to live from the time they are born • Sub-divided into male and female life expectancy • Used in calculating HDI • Factors that contribute to higher life expectancy • Level of health care • Provision of clean water and sanitation • Provision of nationwide education • Reasonable supplies of food • Low levels of poverty • Lack of conflict (war) • Infant mortality rate • Number of deaths of babies under the age of one year per thousand live births in a given year
Education Measures • Adult literacy rate • The proportion of the adult population, 15 and over, which is literate • Should be able to read and write, with understanding, a short statement • Net enrolment ratio in primary education • Ratio of the number of children of primary school age who are enrolled in a primary school • Affected by wealth, distribution of income, and poverty levels
Composite Indicators Used instead of single indicators Combines single indicators with weighing to give a single figure
Human Development Index (HDI) • Difficult to measure • Human Development Index (HDI) • provided by the United Nations Development Program (UNDP) • Looks at three measurable variables – • Long and healthy life (life expectancy) • Improved education (literacy rate) • Decent standard of living (GDP per capita converted at PPP)
How Can the HDI Information Be Used Traditionally, GDP per capita has been used to assess a country’s economic development HDI is compared to GDP per capita to determine how national income translates into economic development HDI underscores the idea that people and their capabilities are the most important criteria in assessing economic development Latest HDI report: http://report.hdr.undp.org/ Human Development Report Media Package: http://hdr.undp.org/en/content/2015-human-development-report-media-package
Other Indicators of Development (GDI & GEM) • Is the HDI sufficient as the only guide to a country’s development? • No, but more efficient than GDP • The gender-related development index (GDI) • HDI adjusted for inequalities between men and women • The gender-empowerment measure (GEM) • measures the extent to which women can actively participate in economic and political life
The Human Poverty Index (HPI) measures level of deprivation and poverty shows how evenly the benefits of development are spread within the country high HPI indicates high level of poverty and deprivation
The Genuine Progress Indicator (GPI) • Measures whether a country’s growth leads to improvement in the welfare of people • Economic growth generates many costs • GPI deducts all costs of growth from GDP • Environmental costs – pollution, resource depletion • Social costs – family breakdown, crime, loss of leisure time • Commuting costs • Costs of automobile accidents
The Future We Want • UNDP Goals • Sustainable Development Goals (SDG’s) (2015): https://www.youtube.com/watch?v=5_hLuEui6ww • The Future We Want (UNDP) (2015) • Equator Initiative • SDG’s • Tax inspectors without borders • Imagine 2020 • Democratic governance
FAO • Climate-Smart Agriculture • Documentary – Turning About (Bangladesh) • 70 Anniversary • 1945 - 1955 • 1955 – 1965 • 1965 – 1975 • 1975 - 1985 • 1985 - 1995 • Food Wastage Footprint
Understanding Poverty Data Poverty Lines How do we measure poverty What is purchasing power parity Why change the International Poverty Line from $1.25 to $1.90 per day? What do the newly released poverty figures reveal?
Gender Equality Eliminate gender-based violence Ghanaian business-woman Bringing Kenyan crafts to the world through e-commerce Empowering women and girls improves the world
Africa & Development Trade and the path out of poverty Staying HIV Free Tourism in Africa Transforming Africa Towards a healthy, wealthy Africa
Impact of Climate Change on Poverty Carbon emissions Pricing carbon Why we need a strong climate deal Fishing alternative for income growth – seaweed Benefits of climate action Green energy Water in Bolivia
World Development Report 2015 Digital dividends Mobile money Digital identity Transforming business online
World Food Program (WFP) Stop hunger Zero hunger
UNICEF Future of Africa Saving lives with water Vaccines are everyone’s business Smuggled out of Afghanistan
Summary Poverty trap/poverty cycles Single indicators Composite indicators Other indicators of development
Source: Economics by Jocelyn Blink & Ian Dorton More Resources: For current Economics issues related to our course, please visit: https://twitter.com/MattBotcheff/