Download
1 / 39
390 likes | 477 Views
California Load Management Standards and How They are Expected to Spur Innovation. Commissioner Arthur H. Rosenfeld, Ph.D California Energy Commission Berkeley Wireless Research Center Granlibakken , CA --- June 1, 2009. Demand Response Event on 7/9/2008 28 Sites Shed 2.2MW.

E N D
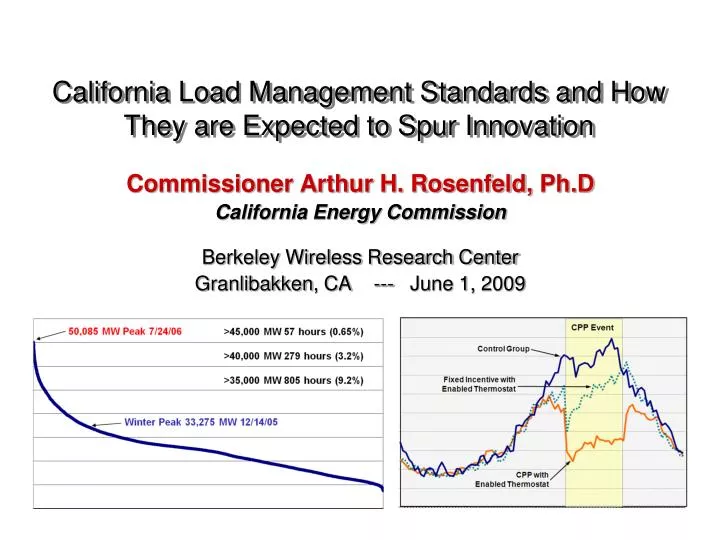
California Load Management Standards and How They are Expected to Spur Innovation Commissioner Arthur H. Rosenfeld, Ph.D California Energy Commission Berkeley Wireless Research Center Granlibakken, CA --- June 1, 2009
Demand Response Event on 7/9/2008 28 Sites Shed 2.2MW
Two Energy Agencies in California • The California Public Utilities Commission (CPUC) was formed in 1890 to regulate natural monopolies, like railroads, and later electric and gas utilities. • The California Energy Commission (CEC) was formed in 1974 to regulate the environmental side of energy production and use. • Now the two agencies work very closely, particularly to delay climate change. • The Investor-Owned Utilities, under the guidance of the CPUC, spend “Public Goods Charge” money (rate-payer money) to do everything they can that is cost effective to beat existing standards. • The Publicly-Owned utilities (20% of the power), under loose supervision by the CEC, do the same.
California Energy Commission Responsibilities Both Regulation and R&D • California Building and Appliance Standards • Started 1977 • Updated every few years • Siting Thermal Power Plants Larger than 50 MW • Forecasting Supply and Demand (electricity and fuels) • Research and Development • ~ $80 million per year • CPUC & CEC are collaborating to introduce communicating electric meters and thermostats that are programmable to respond to time-dependent electric tariffs.
California’s Energy Action Plan • California’s Energy Agencies first adopted an Energy Action Plan in 2003. Central to this is the State’s preferred “Loading Order” for resource expansion. 1. Energy efficiency and Demand Response 2. Renewable Generation, 3. Increased development of affordable & reliable conventional generation 4. Transmission expansion to support all of California’s energy goals. • The Energy Action Plan has been updated since 2003 and provides overall policy direction to the various state agencies involved with the energy sectors
Impact of Standards on Efficiency of 3 Appliances 110 = Effective Dates of 100 National Standards Effective Dates of = State Standards 90 Gas Furnaces 80 75% 70 60% Index (1972 = 100) 60 Central A/C 50 SEER = 13 40 Refrigerators 30 25% 20 1972 1974 1976 1978 1980 1982 1984 1986 1988 1990 1992 1994 1996 1998 2000 2002 2004 2006 Year Source: S. Nadel, ACEEE, in ECEEE 2003 Summer Study, www.eceee.org
New United States Refrigerator Use v. Time and Retail Prices 2,000 25 1,800 1,600 20 1,400 $ 1,270 Refrigerator 1,200 15 Size (cubic ft) Refrigerator volume (cubic feet) Average Annual Energy Use(kwh) or Price($) 1,000 800 10 600 Energy Use per Refrigerator (kWh/Year) 400 5 Refrigerator Price $ 462 in 1983 $ 200 0 0 1947 1952 1957 1962 1967 1972 1977 1982 1987 1992 1997 2002 ~ 100 gallons Gasoline/year ~ 1 Ton CO2/year Source: David Goldstein
In the United States = 80 power plants of 500 MW each
Comparison of 3 Gorges to Refrigerator and AC Efficiency Improvements TWh Wholesale (3 Gorges) at 3.6 c/kWh Retail (AC + Ref) at 7.2 c/kWh Value of TWh 三峡电量与电冰箱、空调能效对比 120 7.5 100 If Energy Star Air Conditioners 空调 80 6.0 2005 Stds Air Conditioners 空调 TWH/Year Value (billion $/year) 2000 Stds 60 4.5 If Energy Star 3.0 40 Savings calculated 10 years after standard takes effect. Calculations provided by David Fridley, LBNL 2005 Stds Refrigerators 冰箱 20 1.5 2000 Stds 0 3 Gorges 三峡 Refrigerators 冰箱 3 Gorges 三峡 标准生效后,10年节约电量
California IOU’s Investment in Energy Efficiency Forecast Crisis Performance Incentives Profits decoupled from sales IRP Market Restructuring 2% of 2004 IOU Electric Revenues Public Goods Charges
Demand Response In 3 cool seasons CA peak is 40 GW, but a/c adds 20 GW in summer So we want demand response to price. So all customers will receive Communicating interval meters, 10 million of them Dynamic pricing: TOU summer afternoon + “critical peak” 10 days/yr Programmable communicating thermostats and controls. Cost premiums are small: $20-30 for meters, $20-30 for thermostats TOU and dynamic pricing will change the design of buildings – promote thermal storage and the use of thermal mass, white roofs, etc. If you announce dynamic prices today, architects will design better buildings tomorrow.
Critical Peak Pricing (CPP)with additional curtailment option Potential Annual Customer Savings: 10 afternoons x 4 hours x 1kw = 40 kWh at 70 cents/kWh = ~$30/year ? 80 Standard TOU 70 Critical Peak Price CPP Price Signal 10x per year Standard Rate 60 Extraordinary Curtailment Signal, < once per year 50 Price (cents/kWh) 40 30 20 10 0 Sunday Monday Tuesday Wednesday Thursday Friday Saturday
Just some of the proposed systems for PCTs and demand response in the residential and small commercial/industrial sectors.
Load Management Standards “Cost effective programs that result in improved utility system efficiency, reduced need for new electricity generation, reduced fuel consumption, and lower long-term economic and environmental costs.”
Current LMS Proceeding(08-DR-01) • Assess which rates, tariffs, equipment, software, protocols, and other measures would be most effective in achieving demand response, and • Adopt regulations and take other appropriate actions to achieve a price responsive electricity market.
Proceeding History (08-DR-01) • IEPR 2007: Proceeding Recommendation • Coordinated with CPUC & ISO • January 2008: OII/IOR 08-DR-01 • March 2 – July 10, 2008: LMS Workshops • Scoping, Smart Grid, Advanced Metering Infrastructure, Rates, Technology, and Education • November 2008: Draft Proposed LMS • December 10, 2008: Draft LMS Workshop • January 2009: All Comments in on Draft • January – March 2009: Stakeholder Meetings
Successful Statewide DR Requires: • Advanced Metering Infrastructure (AMI) • Time-Varying and Dynamic Rates • Information Model • Common Signaling Infrastructure (CSI) • Programmable Communicating Devices (PCDs)
“Programs” vs. Direct Demand Response • Historically, utilities have offered special programs geared toward direct control of loads • Direct Demand Response takes place without the need to sign up for any special program
Load Management Standards Guidelines • Customers should determine which loads are shed first • Demand Response capability should be available to every customer in the state • Customers should not have to participate in utility DR programs • Standards should not hinder customer participation in utility DR programs
Load Management Standards Guidelines (con’t) • Standards should leverage market forces and economies of scale • Standards should be technology neutral • Standards should set minimum technology functional requirements; e.g. an expansion port on every appliance or an override button for thermostats • Customers should have no-cost access to “near-real time” information
Proposed Load Management Standards • LMS -1: Advanced Metering Infrastructure (AMI) Schedule • Purpose: To require all utilities to prepare a plan for deploying advanced meters to all customers within their service territory. • LMS-2: Dynamic Electricity Rates • Purpose: To require utilities to develop and offer rate designs that support the state’s objectives of providing cost-based price signals.
Proposed Load Management Standards • LMS-3: Statewide Time-Differentiated Rate Broadcast • Purpose: To establish a standard method for transmitting current rate and reliability information to customers. • LMS-4: Home Energy Rating System Information • Purpose: To require utilities to provide their customers with information about the Home Energy Rating System, designed to promote the use of in-home energy audits and subsequent cost effective energy efficiency improvements.
Proposed Load Management Standards • LMS-5: Existing Building Peak Energy Efficiency Improvements • Purpose: To require utilities to develop and expand programs to encourage cost effective energy efficiency improvements in existing building stock within their service territory. • LMS-6: Programmable Communicating Device (PCD) Program • Purpose: To require utilities to offer a discounted programmable communicating devices (PCD’s) to customers equipped with advanced meters.
Proposed Load Management Standards • LMS-7: Customer Access to Meter Data • Purpose: To ensure customers have access to information related to their energy usage on a “near real time” basis.
LMS Will Spur Innovation • Goal #1: Actionable information from interval meters should be available on any display device from any physical channel and device, e.g., via cell phones, broadcast digital radio (RDS) and TV (DTV), the Internet, etc. • Goal #2: Time-differentiated energy prices create a need for products that automatically act as an energy management proxy to meet individual consumer preferences.
LMS Will Spur Innovation • Goal #3: Traditional consumer devices such as thermostats and appliances will need to “hear” price and grid-event information from utilities and third parties through a variety of physical channels and merge that information with consumer preferences, local weather, existing personal schedules, existing sensors from security & other systems that may come from local sources, from the web, and will be continuously changing.
LMS Will Spur Innovation • Goal #4: Appliances, thermostats, etc., can’t be stranded as technology changes. Simple pathways must be found to upgrade these devices through low-technology actions such as the standard information port being promoted by the U-SNAP Alliance. • http://www.usnap.org/U-SNAPOverview.pdf
LMS Will Spur Innovation • Goal#5: Appliances, thermostats, etc., must be able to move to new locations with their owners and still receive price and event information from their new utility and/or third-party providers (Common Information Model). • Goal #6: Time-differentiated prices will create a need for products that automatically act as energy management proxies for consumers.
Wireless Can Help • Energy-related communications installations must be simple, low cost & low-energy/power • Ad hoc self-organizing networks (no manuals) • Energy/power scavenged from environment • Must interface & leverage legacy networks, e.g., security, entertainment, home LAN, … • Must facilitate “operational efficiency” through the seamless exchange of information from all local and global network resources