Download
1 / 42
420 likes | 572 Views
Beyond the Current Economic Slowdown Positioning Missoula for Future Economic Prosperity By Dr. Larry Swanson O’Connor Center for the Rocky Mountain West The University of Montana

E N D
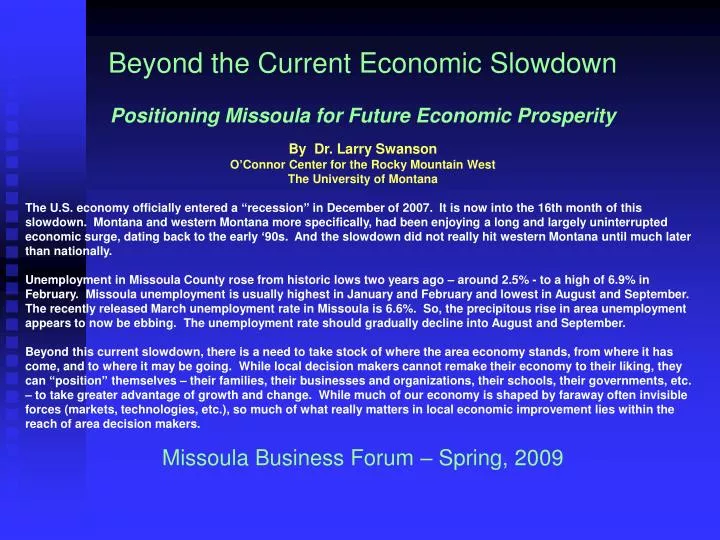
Beyond the Current Economic Slowdown Positioning Missoula for Future Economic Prosperity By Dr. Larry Swanson O’Connor Center for the Rocky Mountain West The University of Montana The U.S. economy officially entered a “recession” in December of 2007. It is now into the 16th month of this slowdown. Montana and western Montana more specifically, had been enjoying a long and largely uninterrupted economic surge, dating back to the early ‘90s. And the slowdown did not really hit western Montana until much later than nationally. Unemployment in Missoula County rose from historic lows two years ago – around 2.5% - to a high of 6.9% in February. Missoula unemployment is usually highest in January and February and lowest in August and September. The recently released March unemployment rate in Missoula is 6.6%. So, the precipitous rise in area unemployment appears to now be ebbing. The unemployment rate should gradually decline into August and September. Beyond this current slowdown, there is a need to take stock of where the area economy stands, from where it has come, and to where it may be going. While local decision makers cannot remake their economy to their liking, they can “position” themselves – their families, their businesses and organizations, their schools, their governments, etc. – to take greater advantage of growth and change. While much of our economy is shaped by faraway often invisible forces (markets, technologies, etc.), so much of what really matters in local economic improvement lies within the reach of area decision makers. Missoula Business Forum – Spring, 2009
Seasonally Adjusted Unemployment since 2000: Montana vs. U.S. Labor force and unemployment data for the U.S. and individual states is compiled and reported monthly by the U.S. Bureau of Labor Statistics (BLS). These data are reported in “raw” form or unadjusted for any seasonality in employment. They also are adjusted to reflect and reduce seasonality in these numbers. The chart shows monthly unemployment in the U.S. and Montana, seasonally adjusted, from January of 2000 through March of 2009. The seasonally adjusted unemployment rate rose to 8.5% in March nationwide, up from 8.1% in February, 7.6% in January, and 7.2% in December. U.S. unemployment has been rising steadily since March of 2007, coming off of its most recent bottom at 4.4%. National unemployment rose to as high as 6.3% in 2003 during the last recession, but now well-exceeds that level. Seasonally adjusted unemployment in Montana had almost always been higher than nationally prior to June of 2001. In every month of every year since then, unemployment in Montana has been lower than nationally. Seasonally adjusted unemployment in Montana had fallen consistently for most of the period to a low of 3.1% in the spring of 2007. The more recent rise in unemployment in Montana is following the national trend, but at significantly lower levels, rising to 5.0% in December when national unemployment was 7.2% and to 6.0% in February when national unemployment was 8.1%. Following this trend, seasonally adjusted unemployment in Montana would be around 6.4% in March.
Seasonally Unadjusted Unemployment since 2000: Montana vs. U.S. The chart at the right shows monthly unemployment rates for both the U.S. and Montana unadjusted for seasonality. The seasonality in unemployment is reflected in the annual increases and decreases in monthly unemployment rates. In March unemployment nationally rose to 9.0%, up only slightly from 8.9% in February and from 8.5% in January and from 7.2% in December. It had bottomed at 4.8% in April of 2008 before beginning its rise. Unemployment in Montana rose to an estimated 7.1% in March, up from 7.0% in February, and from 6.7% in January, and from 5.5% in December. Unemployment in Montana has steadily risen with rising unemployment nationally, but remains almost two percentage points lower than nationally. Historically January is the month of highest unemployment in Montana and unemployment ordinarily begins to fall in February and March. While this didn’t happen, the monthly rise in unemployment has slowed and will very likely fall below the March high in April.
Labor Force & Employment Growth in Montana since the Early ‘90s As the economy of Montana has grown, the labor force has steadily expanded to accommodate this growth. Data are seasonally unadjusted and the waves in the trends reflect seasonality in employment over the course of a given year over time. The gap between the labor force and employment is unemployment. The lower chart shows unemployment rates in Montana over the course of this period of economic expansion. Unemployment rates once swung between 5 and 8%, more recently fell to lows of just over 2%. This reflects Montana’s tightening labor market. The current economic slowdown has altered this trend a bit, but a tight labor market will return when the economy recovers.
Missoula County Unemployment Rate Over Time The U.S. Bureau of Labor Statistics compiles monthly unemployment rates for all U.S. counties and these are unadjusted for seasonality. The unemployment rate in Missoula rose to 6.9% in February, 2009, up from 6.6% in January, and from 5.5% in December. This is the highest level of unemployment in Missoula since 1993 when unemployment rose to 7.5%. The highest rate more recently had been in 2002 when unemployment hit 5.2%. County unemployment reached as high as 10.2% in 1991. So the area economy is not totally unfamiliar with high levels of unemployment. The yearly high for unemployment in Missoula County ordinarily occurs in January or February and the yearly lows ordinarily occur in August and September. The recently released unemployment rate for March indicates the precipitous rise in Missoula’s unemployment has halted, with the rate falling back slightly to 6.6%.
Missoula County Labor Force & Employment Trends, 1990 – 2008 The upper chart shows monthly counts as reported by the U.S. Bureau of Labor Statistics of the total number of persons in the labor force and the number of these who are employed since 1990. The “gap” between the labor force and employment is the number of persons unemployed in any given month. The waves in these data show seasonality each year in employment. The Missoula economy has grown steadily over this period, but is slowing more recently, and unemployment is rising, as shown in the lower chart. The number of unemployed rose to 3,831 in February, 2009, up from 3,703 in January, and up from 3,178 the month previously. Typically, Missoula County experiences its highest levels of yearly unemployment in January and February, and lowest levels in August and September.
Ravalli County Unemployment Rate Over Time The U.S. Bureau of Labor Statistics compiles monthly unemployment rates for all U.S. counties and these are unadjusted for seasonality. The unemployment rate in Ravalli County rose to 9.8% in February, 2009, up from less than 9.5% in January and up from a yearly low of 4.3% last Summer. The February unemployment rate was last exceeded in Ravalli County in 1998 when unemployment reached 9.8%. Unemployment in the county rose to as high as 13% in both 1991 and 1992, so Ravalli County has experienced high levels of unemployment in only the recent past. January and February are months when seasonal unemployment are ordinarily highest. The recent released estimate in March for unemployment in Ravalli is 9.2%, indicating unemployment is beginning to fall.
Flathead County Unemployment Rate Over Time The U.S. Bureau of Labor Statistics compiles monthly unemployment rates for all U.S. counties and these are unadjusted for seasonality. If you look at the pattern of unemployment in Flathead County throughout the ‘90s, you can see than it is very seasonal, rising to yearly highs often times as high as 10% and yearly lows of 5%. In more recent years, the area labor market tightened and unemployment sunk to historic lows of 2.5% as recently as 2007. However, more recently, the area economy is slowing, largely tied to the national economic slowdown and slowdown in housing and construction. Unemployment rose to 12.7% in March, up from 11.8% in February, and 8.7% in January. While rising, high unemployment rates is something that Flathead County has experienced in only the recent past, rising to over 10% several times in the ’90s.
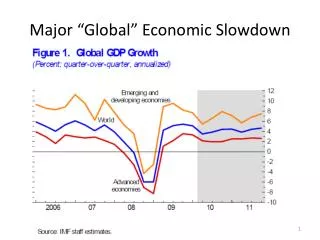
States by Unemployment Rate in August, 2008 The nation-wide recession started in December, 2007. However, the slowdown didn’t affect many states until more recently. The chart shows unemployment rates of individual states in August, 2008. The three northern Plains states of South Dakota, North Dakota, and Nebraska, shown in yellow, had the lowest unemployment rates of any states. Wyoming in the Rocky Mountain West, shown in purple, was 4th lowest, followed by Montana (shown in red). Utah and Idaho, also Rocky Mountain states, also had very low rates. The highest unemployment was in Rhode Island and Michigan, both with unemployment rates exceeding 8%.
Population Growth by State, 1990 – 2007 Population growth in the U.S. has been greatest in several western states, including states in the Rocky Mountain West. Between 1990 and 2007, Nevada grew at a faster pace than any other state – up by 110%. Arizona was 2nd at 72% growth. The next three fastest growing states are in the Rocky Mountain West, including Utah at 53%, Idaho at 48%, and Colorado at 47%. The other two Rocky Mountain West states grew at considerably slower rates – Montana at 20% growth and Wyoming at 15%. Growth during this period nationwide was 21%.
The North American Rocky Mountain West The Rocky Mountains are the “spine of North America,” and extend from western Alberta and eastern British Columbia in Canada south through western Montana and Idaho and further south into portions of western Wyoming, Utah, Colorado, and New Mexico. The Rocky Mountains themselves define the region. The American Rockies are largely contained within the five states of Colorado, Utah, Wyoming, Idaho, and Montana. The Census Bureau includes New Mexico, Arizona, and Nevada in its “Mountain Region” along with these five states. However, Arizona and New Mexico, while having mountains, are much different places culturally, racially, climactically, demographically, and economically. Most people residing in Nevada live next to the California border (Las Vegas and Reno) and it is much different that the Rockies.
Growth Among Rocky Mountain West States While the five Rocky Mountain West states differ considerably in overall populations, they are tending to follow each other closely in year-to-year growth measured in percentage terms. The top chart shows annual change in population for each of the five states since the early ‘80s. The lower chart then merges these five states into one showing annual change in the 5-state Rockies versus annual change in California. Economic and population growth trends in California have tended to heavily shape trends in the Interior West. When the California economy struggles, as it did in the late ‘80s and early ‘90s, population growth in that state has slowed while growth among Rocky Mountain states has risen. When the California economy recovered in the mid-‘90s, population growth increased in California and decreased in the Rocky Mountain West. This pattern seems to be continuing.
Major Population Centers or Region “Cores” and Closely-Linked Counties in the West
City Regions of the Rocky Mountain West Most of the population of the Rocky Mountain West region resides in or nearby one of its major cities. The chart shows the populations of these major city regions in 1990, 2000, and 2007. The 2007 populations in the chart are color-coded to reflect class sizes of these city regions, using the READ or Regional Economies Assessment Database county classification system. Those in maroon are the very largest cities, those in orange are a level down from these in size and so forth. The Denver and Salt Lake City regions are the two largest concentrations of population by far. Next are Colorado Springs-Pueblo, Spokane, Boise, and Fort Collins. The remaining ones are smaller “3rd Tier” cities (blue), larger regional centers (green), and small regional centers (yellow). Montana’s city regions are all modest in size and therefore often not thought of as “real cities.” However, small and medium size cities are now seeing growth and change similar to larger cities.
Rocky Mountain West City Regions by Population Growth The chart shows percentage change in region-wide population for each of the region’s city regions since 1990. St. George, Utah, is seeing the fastest growth, with population rising by 138% between 1990 and 2007. St. George is classified as a “large regional trade center” and colored in green. Boise and Fort Collins, both 2nd Tier regional centers shown in orange, are 2nd and 3rd in growth, increasing by 75% and 63% respectively. Bozeman and Grand Junction are next fastest in growth. Bozeman is a “small regional center.” Grand Junction is a larger regional center. Missoula is classified as a large regional center (green) and its growth of 38% over this period rank it 10th among the 26 city regions in the Rockies.
Rocky Mountain West City Regions by Personal Income Growth The chart shows percentage change in region-wide personal income for each of the region’s city regions since 1990. St. George, Utah, which had the fastest population growth, also s seeing the fastest personal income growth, with income rising by 205% between 1990 and 2006. Bozeman has the 2nd fastest growth in income. Both St. George and Bozeman are relatively small regional trade centers, but they illustrate how income growth is now extending beyond the region’s largest cities and into smaller ones. Personal income growth by 86% in the Missoula city region during this period, ranking it 12th fastest among all city regions in the Rockies.
The Rocky Mountain West is one of the U.S.’s fastest growing regions During the last decade, the Rocky Mountain West emerged one of the fastest-growing regions in the U.S. with one of the fastest growing regional economies. The Rockies also had one of the highest percentage increases in per capita income; up 23% in inflation-adjusted dollars.
Employment Change in the Fast-growing Rockies and in Montana In the last decade when the economy of the Rocky Mountain West became one of the fastest-growing regional economies in the nation, employment growth in the broad services sector accounted for 37 percent of all new jobs in the region. There are 13 major sectors of the economy and two of these, services and retail trade, accounted for nearly half of all employment. The sector with the third highest employment is Finance, Insurance, and Real Estate, or the F.I.R.E. sector, followed by manufacturing, construction, and local government (which includes public education). There is a common perception in Montana that the state’s economy is deteriorating, with many citing the growth in service and retail trade jobs and the loss of other “good” jobs in the economy. In actuality, the changing mix of jobs in Montana closely parallels the changing mix of jobs in the larger Rocky Mountain West region; which has seen significant gains in economic performance in recent years. In the last decade while service jobs grew by 37 percent in the fast-growing Rockies, they grew by 42 percent in Montana. And, while services and retail trade now account for nearly half of all jobs in the Rockies, they accounted for 49 percent of jobs in Montana in 2000.
Recent Economic Restructuring in Montana Ways in which the Montana economy is changing and restructuring itself can be seen by grouping some of the major sectors of the economy into larger segments. In the chart at right, Professional and technical services, Administrative services, Management services, and Information services are joined in a larger segment called “Professional and business services.” Primary sectors (Manufacturing, Utilities, Transportation) are joined as are Wholesale and Retail trade. Construction and Real estate are merged, as are State and Federal government. Ag-related sectors are merged and Arts, entertainment, and recreation services are merged with Accommodation and Food services. The segment of the economy with the highest labor earnings is Federal and State government. This includes earnings by all persons employed somewhere in federal and state government. Wholesale and retail trade is 2nd, followed by Health care, Construction and real estate, Primary industries, and Professional and business services.
Growth among Major Segments of the Montana Economy, 1998 – 2006 The chart focuses on growth in labor earnings only in this recent period from 1998 to 2006, with growth measured in inflation-adjusted labor earnings. The most striking change occurring in recent years in the Montana economy has been the high growth in Construction and Real Estate. This major segment of the economy is highly growth dependent and has been spurred by population growth in the state and subsequent expansion in other segments of the economy, like services and trade. Professional and Business services - ranging from accounting, engineering, management, administrative, legal, and computing services of many types – has experienced the 2nd highest growth among major segments, closely followed by growth in Health care and Federal and State government. Trade sectors are growing and rank 5th among these 11 major segments of the economy. Mining also has seen some increase in recent years. Ag-related sectors are declining.
Growth in Montana’s Overall Economy vs. Growth in Its Natural Resource Industries The chart shows annual levels of total personal income and total labor earnings in Montana since the early ‘90s in relation to labor earnings generated in all of Montana’s natural resource sectors – oil and gas, coal mining, other mineral mining, wood products, farming and ranching (net farm income), etc. The overall economy has grown steadily through this entire period, while natural resource industries shrank a bit in the ‘90s before increasing modestly in more recent years, largely because of increased oil and gas activity. The lower chart shows yearly changes in total personal income, all labor earnings, and all labor earnings in natural resource industries. The overall economy grew in many years even as declines occurred in natural resource sectors. Natural resource sectors could not have driven much of the growth.
Reduced Economic Dependency on Natural Resources Industries by the Montana Economy Because Montana’s economy has grown so much over the last two decades, even as many of its natural resource industries either declined or saw little or only modest growth, the economic dependency on these natural resource industries has decreased. The chart shows labor earnings by all natural resource sectors in Montana and the labor earnings generated by these sectors as percents of all personal income and all labor earnings for each year since 1990. In 1993 natural resource industries accounted for over 15% of all employment earnings. But, in 2006 this had declined to 8.4%. As a share of total personal income, natural resource labor earnings have decline from 11% of all income in 1993 to 6% in 2006. While Montana's natural resource sectors continue to be important contributors to the state’s overall economy, they are becoming smaller shares of the economy through the state’s recent economic expansion and continuing restructuring.
A More “Footloose” Economy – both People and Jobs. Advances in information technology and communications and communications infrastructure, emergence of a services-based economy, steady aging of the U.S. population, and rapid increases in non-labor and more mobile sources of income .. have re-designed the modern workplace, re-organized the geography of economic activity, and reshuffled patterns of migration and population growth. In short, today’s economy is much more “footloose” than yesterday’s. Both people and jobs are moving around more freely and new patterns of migration are emerging. The “old” economy encouraged urbanization and sub-urbanization. The “new” economy increasingly encourages growth to occur mostly in places where people want to live. In the old economy, people followed jobs. In this newly emerging economy, jobs increasingly follow people. Many mid-size cities and outlying non-metro areas – particularly ones with attractive communities in areas with high quality environmental amenities – have become very fast growing. - Larry Swanson, O’Connor Center for the Rocky Mountain West, U. of MT
Urban-to-Rural Distribution of Population Growth in Montana The upper chart shows the distribution of recent population growth in Montana by county from urban-to-rural during the ten-year period from 1996 to 2006. The lower chart then shows growth among county groupings – the 7 regional center counties, the 27 counties nearby and closely-linked to these regional centers, and the other 22 more rural and isolated counties. The population of Montana grew by 60,540 people during this period, but the seven regional center counties by themselves grew by 61,573. Counties nearby these centers grew as a group by 10,723, while the isolated counties lost 11,755 in population.
Population Distribution by County in Montana The upper chart shows the population of Montana by county in 2008 with counties arrayed from left-to-right in the chart according to their urban-rural characteristics. The seven regional center counties are at the far left. The more rural counties, mainly in the east, are at the right. The lower chart shows population change in Montana by county since 2000. Montana’s population is concentrated in its more urban counties and its growth is further concentrating this population in and nearby the urban centers.
Distribution of “Natural Change” and “Net Migration” in Montana since 2000 The upper chart shows population change by county resulting from natural change, or births and deaths, since 2000. The bottom chart shows change resulting from net migration. Over half of Montana’s population growth is resulting from net migration, but only a few counties are seeing much growth from this. Growth from natural change also is concentrated in a few counties, mainly the more populated urban counties and counties nearby.
Age Shifts Among the U.S. Population The upper chart shows the number of people living in the U.S. by single age in 1990 and ten years later in 2000. The lower chart then shows changes in the number of persons for each age during the decade of the ‘90s. The greatest growth in the population occurred among persons in their early 40s to early 60s. These are classic “baby boomers” or persons born after W.W. II between 1947 and 1963. The tremendous rise in the number of births during this post-war period has skewed the distribution of the U.S. population, making baby boomers the largest age group among the population. The next largest is the children of boomers or the “echo” group. These bulges in the U.S. population age profile are continuing to ripple forward and are contributing to the accelerated aging of the population.