Figure 8.2
220 likes | 579 Views
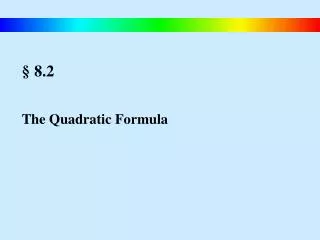
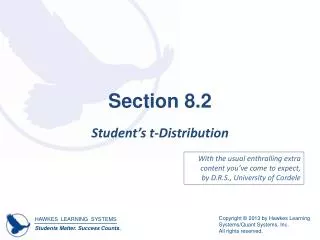
A diver has more potential energy on the platform than in the water. Diving converts potential energy to kinetic energy. What is energy?. Figure 8.2. Climbing up converts the kinetic energy of muscle movement to potential energy.

Figure 8.2
E N D
Presentation Transcript
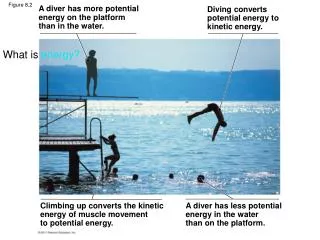
A diver has more potentialenergy on the platformthan in the water. Diving convertspotential energy tokinetic energy. What is energy? Figure 8.2 Climbing up converts the kineticenergy of muscle movementto potential energy. A diver has less potentialenergy in the waterthan on the platform.
Potential energy is energy to do work Figure 8.5b (b) Diffusion (c) Chemical reaction (a) Gravitational motion
• More free energy (higher G)• Less stable• Greater work capacity Figure 8.5a In a spontaneous change• The free energy of the system decreases (G 0)• The system becomes more stable• The released free energy can be harnessed to do work • Less free energy (lower G)• More stable• Less work capacity
(a) Exergonic reaction: energy released, spontaneous Reactants Amount of energyreleased(G 0) Energy Free energy Products Figure 8.6 Progress of the reaction (b) Endergonic reaction: energy required, nonspontaneous Products Amount of energyrequired(G 0) Energy Free energy Reactants Progress of the reaction
G 0 G 0 At equilibrium work is not possible Work is possible (a) An isolated hydroelectric system Figure 8.7 (b) An open hydro- electric system An open system is never at equilibrium, but in a steady-state equilibrium or homeostasis. G 0 G 0 G 0 G 0 (c) A multistep open hydroelectric system
G < 0 G < 0 G < 0 Enzyme 1 Enzyme 2 Enzyme 3 A B D C Reaction 1 Reaction 2 Reaction 3 Starting molecule Product Free energy A multistep open hydroelectric system Metabolic pathways are open systems LE 8-7c
Adenine Phosphate groups Ribose Figure 8.8 (a) The structure of ATP ATP is a high energy compound whose energy can be used to do work Adenosine triphosphate (ATP) Energy Inorganicphosphate Adenosine diphosphate (ADP) (b) The hydrolysis of ATP
Glutamic acidconversionto glutamine (a) Conversionreactioncoupledwith ATPhydrolysis (b) (c) Free-energychange forcoupledreaction NH3 NH2 GGlu = +3.4 kcal/mol Glu Glu Glutamine Ammonia Glutamicacid NH3 Figure 8.9 P 2 1 NH2 ADP ADP P i ATP Glu Glu Glu Phosphorylatedintermediate Glutamicacid Glutamine GGlu = +3.4 kcal/mol NH2 NH3 ADP P i ATP Glu Glu GGlu = +3.4 kcal/mol GATP = 7.3 kcal/mol + GATP = 7.3 kcal/mol Net G = 3.9 kcal/mol
Transport protein Solute ATP ADP P i P P i Figure 8.10 Solute transported (a) Transport work: ATP phosphorylates transport proteins. Cytoskeletal track Vesicle ATP ADP P i ATP Motor protein Protein andvesicle moved (b) Mechanical work: ATP binds noncovalently to motor proteins and then is hydrolyzed.
ATP H2O Figure 8.11 Energy for cellularwork (endergonic,energy-consumingprocesses) Energy fromcatabolism (exergonic,energy-releasingprocesses) ADP P i
A B Free energy profile of a chemical reaction D C Transition state Figure 8.12 A B EA D C Free energy Reactants A B G O C D Products Progress of the reaction
Course ofreactionwithoutenzyme EAwithoutenzyme EA withenzymeis lower Figure 8.13 Reactants Free energy Course ofreactionwith enzyme G is unaffectedby enzyme Products Progress of the reaction
Substrate Figure 8.14 Active site Enzyme Enzyme-substratecomplex (a) (b)
Substrates enter active site. 1 2 Substrates are heldin active site by weakinteractions. Substrates Enzyme-substratecomplex Figure 8.15-3 Active site canlower EA and speedup a reaction. 3 6 Activesite isavailablefor two newsubstratemolecules. Enzyme Products arereleased. 5 Substrates areconverted toproducts. 4 Products
Optimal temperature forenzyme of thermophilic(heat-tolerant)bacteria (77°C) Optimal temperature fortypical human enzyme (37°C) Rate of reaction Figure 8.16 120 60 0 20 40 100 80 Temperature (°C) (a) Optimal temperature for two enzymes Optimal pH for pepsin(stomachenzyme) Optimal pH for trypsin(intestinalenzyme) Rate of reaction 0 3 5 7 8 9 10 1 2 4 6 pH (b) Optimal pH for two enzymes
(a) Normal binding (b) Competitive inhibition (c) Noncompetitive inhibition Substrate Figure 8.17 Activesite Competitiveinhibitor Enzyme Noncompetitiveinhibitor
(b) Cooperativity: another type of allosteric activation (a) Allosteric activators and inhibitors Active site(one of four) Allosteric enzymewith four subunits Substrate Figure 8.19 Regulatorysite (oneof four) Activator Stabilized activeform Inactive form Stabilized active form Active form Oscillation Inhibitor Non-functionalactive site Inactive form Stabilized inactiveform
Initial substrate(threonine) Active siteavailable Threoninein active site Enzyme 1(threoninedeaminase) Isoleucineused up bycell Figure 8.21 Intermediate A Active site ofenzyme 1 isno longer ableto catalyze theconversionof threonine tointermediate A;pathway isswitched off. Feedbackinhibition Enzyme 2 Intermediate B Enzyme 3 Intermediate C Isoleucinebinds toallostericsite. Enzyme 4 Intermediate D Enzyme 5 End product(isoleucine)