Download
1 / 24
240 likes | 385 Views
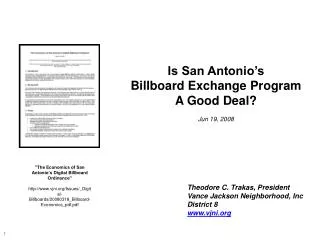
Is San Antonio’s Billboard Exchange Program A Good Deal? Jun 19, 2008. ”The Economics of San Antonio’s Digital Billboard Ordinance” http://www.vjni.org/Issues/_Digital-Billboards/20080318_Billboard-Economics_pdf.pdf. Theodore C. Trakas, President Vance Jackson Neighborhood, Inc

E N D
Is San Antonio’s Billboard Exchange Program A Good Deal? Jun 19, 2008 ”The Economics of San Antonio’s Digital Billboard Ordinance” http://www.vjni.org/Issues/_Digital-Billboards/20080318_Billboard-Economics_pdf.pdf Theodore C. Trakas, President Vance Jackson Neighborhood, Inc District 8 www.vjni.org
Anaheim, CA Exchange Program • Good Process • Open • Well considered (~2yrs and counting) • Solid basis in economics • Request for Information (RFI) • Independent Study Let’s concentrate on ‘economics’ . . .
Anaheim City CouncilSeptember 12, 2006 “Mayor Pringle recommended the RFI process” (Page 6) ‘RFI’ = Request for Information http://www.anaheimplatinumtriangle.com/docs_agend/questys_pub/MG11771/AS11810/AS11813/AI13417/DO13428/1.DOC
Summary of Proposals • Bulletin Displays, LLC/Vista Media • Bulletin Displays, LLC (Message Center Proposal) • CBS Outdoor • Clear Channel • Regency Outdoor Advertising, Inc http://www.anaheim.net/docs_agend/questys_pub/MG18947/AS18986/AS18990/AI19170/DO19184/DO_19184.PDF Clear Channel . . .
Clear Channel ProposalJune 5, 2007 Submitted on June 5, 2007 http://www.anaheim.net/docs_agend/questys_pub/MG18947/AS18986/AS18990/AI19170/DO19178/DO_19178.PDF
Clear Channel ProposalJune 5, 2007 Removes 48 30-sheet (282 Sq Ft) billboards from street locations
Clear Channel ProposalJune 5, 2007 Adds 9 14’x48’ (672 sq ft) new billboards to highway locations Exchange Ratio = 48:9 = 5.3:1 Did Anaheim city council accept it?
Anaheim City Council DecisionNovember 6, 2007 No! “25. Reject all proposals received in response to a Request for Information related to a potential billboard exchange program on the basis that they are either incomplete or do not demonstrate the level of community benefit necessary to warrant further consideration.” Why did they come to this decision? http://www.anaheim.net/docs_agend/questys_pub/MG18998/AS19037/AS19040/AI19567/DO19578/DO_19578.PDF
Independent StudyNovember 6, 2007 Independent Study “City Council also commissioned a billboard exchange analysis prepared by SanliPastore & Hill (SP&H)” Revenue Estimates • “The report identified the following average annual advertising rates for a street-oriented billboard: • $3,600 for a 8-sheet (approximately 72 square foot) billboard • $32,400 for a 30-sheet (approximately 300 square foot) billboard • $120,000 for a bulletin (approximately 700-1200 square foot) billboard • The advertising rate for a freeway-oriented billboard ranges from approximately $342,000 to $360,000 per year.” Independent Proposal of Exchange Ratios • “(T)he report provided staff with the following exchange rates suitable in exchange for the construction of one freeway-oriented billboard face (billboards are usually single or double-faced): • 54 to 82 8-Sheet Billboard Faces • 8 to 14 30-Sheet Billboard Faces • 1 to 2 Bulletin Billboard Faces “ http://www.anaheim.net/docs_agend/questys_pub/MG18947/AS18986/AS18990/AI19170/DO19171/DO_19171.PDF Items related to Clear Channel Proposal Their study recommended ‘8-14 to 1’ , not ‘5.3 to 1’
How this relates to SA • The RFI Responses • The Independent Study
Similar Clear Channel Proposal (5.3:1) San Antonio ratio for this case (5:1) But on the other hand . . . .
Different Anaheim’s exchange was limited to relocate signs from streets to highways But CC proposed 1 in 9 signs as digital
How this relates to SA • The RFI Responses • The Independent Study
Extrapolate Anaheim’s Study Revenue Estimates • “The report identified the following average annual advertising rates for a street-oriented billboard: • $3,600 for a 8-sheet (approximately 72 square foot) billboard • $32,400 for a 30-sheet (approximately 300 square foot) billboard • $120,000 for a bulletin (approximately 700-1200 square foot) billboard • The advertising rate for a freeway-oriented billboard ranges from approximately $342,000 to $360,000 per year.” Extrapolate to San Antonio Traffic Density Standard of Living Competition http://www.anaheim.net/docs_agend/questys_pub/MG18947/AS18986/AS18990/AI19170/DO19171/DO_19171.PDF
The San Antonio Study • ‘A back of the envelope calculation’ • for the 30-sheet case • Billboard revenues change • $120,000 $1,600,000 (+1336%) • Assuming digital billboard cost $500,000, then gross return on investment is • ($1,600,000 - $120,000) / $500,000 • = 300% (per annum) • If 50% gross return on investment (cost of capital) is required, then the SA Ordinance is too generous by • 300% / 50% = 600% • So the San Antonio exchange ratio should be 6x larger: • (5:1) x 6 = 30:1 ”The Economics of San Antonio’s Digital Billboard Ordinance” http://www.vjni.org/Issues/_Digital-Billboards/20080318_Billboard-Economics_pdf.pdf
Visual Impact 1336% (13x) the income Means 1336% (13x) the visual impact! Points to a Fundamental Weakness of Voluntary Exchange Programs. Companies won’t participate unless there’s more income (and visual impact) for them!
Summary • Anaheim is a good model for this issue • Open, deliberate, and good economics (RFI & independent study) • Exchange Ratios (1) • San Antonio ordinance 5:1[Passive Digital ] • Clear Channel 6/5/07 Proposal 5.3:1[ 48 Passive s 8 Passives + 1 Digital ] • Anaheim study (2) 8-14:1[ Passive Passive ] • San Antonio study(3) 30:1[Passive Digital ] • Anaheim rejected all RFI proposals, including Clear Channel’s 6/5/07 proposal which was • 9x better than San Antonio’s Digital Ordinance!(4) (1) Exchange ratios all apply to one case: old 30-sheet billboards new 672 Sq Ft billboards (2) Anaheim exchanges dealt with relocation of street to highway billboards (3) My rough order of magnitude calculation – should be reproduced professionally (4) Because their 6/5/07 proposal had 9x fewer new digital billboards
San Antonio’s Pilot • The Good - Heroic actions by council persons are laudable, but • Not the basis for good public policy • We need a viable, sustainable, credible process • The Bad - Uncovered structural problems • The industry will try to game the process • City staff is not up to policing industry • The Ugly - Will never change the economic fundamentals • San Antonio’s “4:1” ordinance is not a good deal for the city and its citizens What now?
Mid-Course Correction • Condemn non-compliant billboards in the city • These should not be eligible for exchange! • Monitor the pilot ordinance. • Calculate the specific economic impacts and return on investment, on an exchange by exchange basis, of the pilot program. • Develop, assess and compare courses of actions (COAs), such as: • Pilot Ordinance. Assess future trends under the event that the pilot program is renewed or made permanent. • Previous Ordinance. What would happen if San Antonio rolled back to the prior Sign, Scenic and Urban Corridor Ordinances? • Total Ban. What would happen if San Antonio strengthened its ordinance to ban all new billboards? • Rolling Exchange Rates*. Leverage the time value of money. Increment old-vs-new exchange rates over time to progressively flush the most marginal billboards from industry inventory and San Antonio urbanscape. • Other? For all these COAs, project billboard inventories over time • Contract professional, independent studies • Use billboard fees to pay for studies • Raise fees as needed * If we wanted to be economically smart, we’d do it this way
Visit our Web Page www.vjni.org/Issues
Digital vs. Passive Incomes • “Seven standard billboards in Cleveland, Clear Channel Outdoor's first "digital" billboard market, returned $380,000 in revenue from July 2004 to July 2005. In July 2005, the standard billboards were converted to digital. The new billboards generated $3.5 million from January 2006 to December 2006, according to company projections.” [Ref C4.] • “If ads could be updated quickly and cost-effectively by electronic means, billboard operators could rotate ads throughout the day with multiple advertisers per unit. Digital currently has appealing economics, with five to 10 times higher revenue per unit based on my calculations.” [Ref C5.] • “New focus: one board for many advertisers. Aside from raising rates, an outdoor advertising (OA) company's best strategy for growing revenue had been to erect additional billboards. The more billboards, the higher the revenue. However, strict cap and replace ordinances often limit the number of billboards a company can own. This will lead outdoor advertising companies to look to technology--in the form of digital billboards--to grow revenue through more efficient boards. Digital billboards allow several advertisers to share the same billboard, multiplying revenue from an individual board by as much as six to eight times.” [Ref C6.] • “But the digital billboards offer increased revenues opportunities for the outdoor advertising companies. A single digital billboard can bring in up to six times the revenue of a traditional one.” [Ref C7.] • “Each digital sign produces $14,000 a month in revenue, typically from multiple advertisers, compared with $1,000 to $2,000 for traditional billboards, which serve only one advertiser.” [Ref C8.] Source: ”The Economics of San Antonio’s Digital Billboard Ordinance”, http://www.vjni.org/Issues/_Digital-Billboards/20080318_Billboard-Economics_pdf.pdf Digitals yield 5–15x the revenue of passives - with all other factors equal