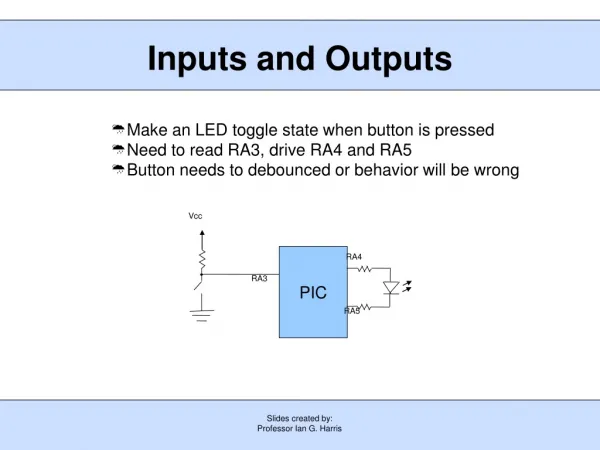
Download
1 / 45
450 likes | 470 Views
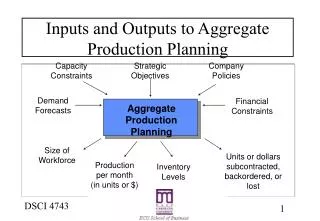
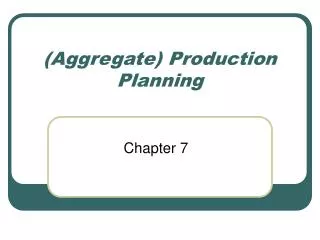
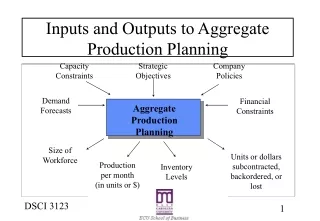
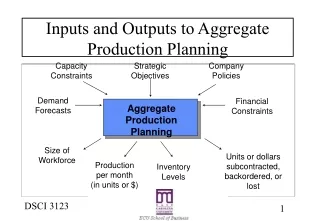
Capacity Constraints. Strategic Objectives. Company Policies. Demand Forecasts. Financial Constraints. Aggregate Production Planning. Size of Workforce. Units or dollars subcontracted, backordered, or lost. Production per month (in units or $). Inventory Levels.

E N D
Capacity Constraints Strategic Objectives Company Policies Demand Forecasts Financial Constraints Aggregate Production Planning Size of Workforce Units or dollars subcontracted, backordered, or lost Production per month (in units or $) Inventory Levels Inputs and Outputs to Aggregate Production Planning
Material Requirements Planning (MRP) • A computerized inventory control & production planning system • Schedules component items when they are needed - no earlier and no later
When to Use MRP • Dependent and discrete items • Complex products • Job shop production • Assemble-to-order environments
Material Requirements Planning Product Structure File Inventory Master File MRP Inputs & Outputs Master Production Schedule Planned Order Releases Work Orders Purchase Orders Rescheduling Notices
MRP Inputs • Master production schedule • Product structure file • Inventory master file
Master Production Schedule • Drives MRP process with a schedule of finished products • Quantities represent production not demand • Quantities may consist of a combination of customer orders & demand forecasts • Quantities represent what needs to be produced, not what can be produced
Board (1) Pressboard (1) Finish (2oz.) Product Structure Tree Clipboard Level 0 Clip Assembly (10) Rivet (2) Level 1 Top Clip (1) Bottom Clip (1) Pivot (1) Spring (1) Level 2 Sheet Metal (8 in2) Sheet Metal (8 in2) Spring Steel (10 in.) Iron Rod (3 in.) Level 3
Indented Bill of Material LEVEL ITEM Unit of Measure Quantity 0 - - - - Clipboard Ea 1 - 1 - - - Clip Assembly Ea 1 - - 2 - - Top Clip Ea 1 - - - 3 - Sheet Metal In2 8 - - 2 - - Bottom Clip Ea 1 - - - 3 - Sheet Metal In2 8 - - 2 - - Pivot Ea 1 - - - 3 - Iron Rod In 3 - - 2 - - Spring Ea 1 - - - 3 - Spring Steel In 10 - 1 - - - Rivet Ea 2 - 1 - - - Board Ea 1 - - 2 - - Press Board Ea 1 - - 2 - - Finish Oz 2
Specialized BOMS • Phantom bills • transient subassemblies • never stocked • immediately consumed in next stage • K-bills • group small, loose parts under pseudoitem # • reduces paperwork
Specialized BOMS • Modular bills • product assembled from major subassemblies & customer options • modular bill kept for each major subassembly • simplifies forecasting & planning • X10 Automobile example 3 x 8 x 3 x 8 x 4 = 2,304 configurations 3 + 8 + 3 + 8 + 4 = 26 modular bills
Inventory Master File Description Inventory Policy Item Board Lead time 2 Item no. 7341 Annual demand 5,000 Item type Manuf. Holding cost 1 Prod/sales Ass’y Ordering/setup cost 50 Value class B Safety stock 25 Buyer/planner RSR Reorder point 39 Vendor 07142 EOQ 316 Phantom code N Minimum order qty 100 Unit price/cost 1.25 Maximum order qty 500 Pegging Y Multiple order qty 100
Inventory Master File, Con’t. Physical Inventory Usage/Sales On hand 100 YTD usage/sales 1,100 Location W142 MTD usage/sales 75 On order 50 YTD receipts 1,200 Allocated 75 MTD receipts 0 Cycle 3 Last receipt 8/25 Difference -2 Last issue 10/5 Codes Cost acct. 00754 Routing 00326 Engr 07142
Inventory Accuracy 1. Maintain orderly stockrooms 2. Control access to stockrooms 3. Establish & enforce procedures for inventory withdrawal 4. Ensure prompt and accurate entry of inventory transactions 5. Take physical inventory count on a regular basis 6. Reconcile inventory discrepancies in a timely manner (use cycle counting)
The MRP Matrix ITEM: LLC: Lot Size: LT: PD 1 2 3 4 5 6 7 8 9 Item Gross Requirements Scheduled Receipts Projected On Hand Net Requirements Planned Order Receipts Planned Order Releases
Parts Of MRP Matrix • Item name or number identifying scheduled item • LLC low-level-code; lowest level at which item appears in a product structure • Lot size order multiples of this qty; can be min/max qty • LT (lead time)-time from order placement to receipt • PD (past-due)-orders behind schedule • Gross requirements-demand for item by time period
Parts Of MRP Matrix • Scheduled receipts • quantity already on order & receipt date • released orders become scheduled receipts • Projected on hand - expected on-hand inventory at end of period • Net requirements - net amount needed after on-hand adjustments • Planned order receipts - net requirements adjusted for lot-sizing • Planned order releases - planned order receipts offset by lead time
MRP Example A LT=3 B (3) LT=4 C (2) LT=2 ItemOn Hand Scheduled Receipts Lot Size MPS A 10 0 1 100, period 8 B 5 0 1 - - - C 140 0 150 - - -
Manufacturing Resource Planning (MRP II) • Extension of MRP • Plans all resources needed for running a business • Variations include • Service Requirements Planning (SRP) • Business Requirements Planning (BRP) • Distribution Requirements Planning (DRP)
Forecasting Customer order entry Production planning / master production scheduling Product structure / bill-of-material processor Inventory control Material requirements planning Capacity planning Shop floor control Purchasing Accounting Financial analysis MRP II Modules
Capacity Requirements Planning (CRP) • Computerized system that projects loads from the planned order releases of MRP • Creates load profile • Identifies underloads and overloads
Business Plan Marketing Plan Financial Plan Production Plan Feasible? No more Yes MRP II Diagram
Master production schedule Feedback Material requirements planning Capacity requirements planning No Feasible? Yes Purchase orders Work orders Inventory Shop floor control Manufacture
Advanced Planning & Control Systems • Enterprise Resource Planning (ERP) • updates MRP II with relational DBMS, GUI & client/server architecture; covers entire enterprise • Manufacturing Execution Systems (MES) • links business planning & mgmt control systems • Customer-Oriented Manufacturing Management Systems (COMMS) • unites departments & suppliers around customer • multi-plant planning, multiple languages & currencies
Problems with MRP • Material requirements plan is first; capacity is an afterthought • MRP assumes fixed lead times • Excessive reporting requirements
Prospects for MRP/MRP II • Coordinates strategy among different functional areas • Responds quickly to what-if? questions at various levels • BOM processors, purchase modules, & customer order entry are standard requirements for Manufacturing Information Systems • Monitors design & vendor quality, & customer service • Builds trust, teamwork, & better decisions • Cash-flow planning & profit/cost projections
Items Production Planning Capacity Planning Resource level Product lines or families Aggregate Resource Plants Production Plan Requirements Plan Individual products Critical work centers Master Production Rough-Cut Schedule Capacity Plan All work centers Material Capacity Components Requirements Plan Requirements Plan Manufacturing operations Individual machines Shop Floor Input/Output Schedule Control Hierarchical Planning Process
Master Production Schedule Period MPS 1 2 3 4 5 6 7 8 Item Clipboard 86 93 119 100 100 100 100 100 Lapboard 0 50 0 50 0 50 0 50 Lapdesk 75 120 47 20 17 10 0 0 Pencil Case 125 125 125 125 125 125 125 125 What different strategies for planning production are shown here?
Modular Bill Of Material X10 Automobile Engines Exterior Interior Interior Body (1 of 3) Color (1 of 8) (1 of 3) Color (1 of 8) (1 of 4) 4-Cylinder (.40) Bright Red (.10) Leather (.20) Grey (.10) Sports Coupe (.20) 6-Cylinder (.50) White Linen (.10) Tweed (.40) Light Blue (.10) Two-Door (.20) 8-Cylinder (.10) Sulphur Yellow (.10) Plush (.40) Rose (.10) Four-Door (.30) Neon Orange (.10) Off-white (.20) Station Wagon (.30) Metallic Blue (.10) Cool Green (.10) Emerald Green (.10) Black (.20) Jet Black (.20) Brown (.10) Champagne (.20) B/W Checked (.10)
Initial Load Profile Hours of capacity Normal capacity 1 2 3 4 5 6 Time (weeks)
Adjusted Load Profile Hours of capacity Work an extra shift Overtime Push back Pull ahead Push back 1 2 3 4 5 6 Time (weeks)
Calculating Capacity • 2 copiers, 2 operators • 5 days/wk, 8 hr/day • 1/2 hr meals, 1/2 hr maintenance per day • Efficiency = 100% • Utilization = 7/9 = 87.5% Daily capacity = 2 machines x 2 shifts x 8 hours/shift x 100% efficiency x 87.5% utilization = 28 hours or 1,680 minutes
Determining Load & Load % Job Setup Run time Total # Copies time (min) (min/unit) Time Load 10 500 5.2 0.08 5.2 + (500 x 0.08) = 45.2 20 1,000 10.6 0.10 10.6 + (1,000 x 0.10) = 110.6 30 5,000 3.4 0.12 3.4 + (5,000 x 0.12) = 603.4 40 10,000 11.2 0.14 11.2 + (10,000 x 0.14) = 1,411.2 50 2,000 15.3 0.10 15.3 + (2,000 x 0.10) = 215.3 2385.7 min Load percent = 2,385.7 / 1,680 = 1.42 x 100% = 142% Add another shift: Daily capacity = 2 machines x 3 shifts x 8 hours/shift x 100% efficiency x 87.5% utilization = 42 hours or 2,520 minutes Revised load percent = 2,385.7 / 2,520 = 0.9467 x 100% = 94.67%
Remedies for Underloads 1. Acquire more work 2. Pull work ahead that is scheduled for later time periods 3. Reduce normal capacity
Remedies for Overloads 1. Eliminate unnecessary requirements 2. Reroute jobs to alternative machines or work centers 3. Split lots between two or more machines 4. Increase normal capacity 5. Subcontract 6. Increase the efficiency of the operation 7. Push work back to later time periods 8. Revise master schedule
Splitting Orders Lathes overloaded, shift work to milling Machine Setup time Run time Lathe 30 min 5 min Mill 45 min 10 min Three options for producing parts 1. Produce 100 units on lathe 2. Split 50:50 between lathe & mill 3. Optimal split between lathe & mill
Options 1 And 2 1. Produce 100 units on lathe • 30 + 5(100) = 530 min 2. Split 50:50 between lathe & mill • 30 + 5(50) = 280 min on lathe • 45 + 10(50) = 545 min on mill Job completion time = 545 minutes
Option 3 3. Optimal split: x on lathe, 100-x on mill • 30 + 5x = 45 + 10(100-x) • 5x = 15 + 1000 - 10x • 15x = 1015 x = 67.66 or 68 units on lathe,(100-x) = 32 units on mill • 30 + 5(68) = 370 min on lathe • 45 + 10(32) = 365 min on mill Job completion time = 370 minutes
MRP planned order releases Capacity requirements planning Open orders file Routing file Load profile for each machine center Capacity Requirements Planning
Capacity Terms • Load profile - compares released and planned orders with work center capacity • Capacity - productive capability; includes utilization and efficiency • Utilization - % of available working time spent working • Efficiency - performance compared to a standard • Load - the standard hours of work assigned to a facility • Load percent - the ratio of load to capacity
The Alpha Beta Company A LT=3 B LT=2 C (3) LT=4 D (2) LT=2 D (3) LT=2 ItemOn Hand Scheduled Receipts Lot Size MPS A 10 0 1 100, period 8 B 5 0 1 200, period 6 C 140 0 150 - - - D 200 250, period 2 250 - - -
Alpha Beta Planned Order Report Period Item Quantity 1 C 150 2 D 250 3 D 250 4 B 195 5 A 90