Download
1 / 32
320 likes | 44.71k Views
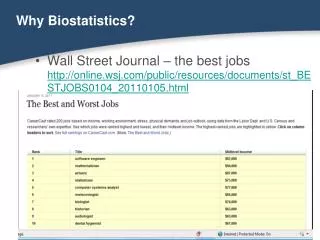
Vplot (or, why I took 7 ½ years to graduate...). Reproducible research workshop UBC, Vancouver, 2006 Joseph A. Dellinger geojoe@freeusp.org. Where did Vplot come from?. SEP was one of the first users of Unix Jon just loved to buy fancy new graphics devices Gould (200 dpi printer)

E N D
Vplot(or, why I took 7 ½ years to graduate...) Reproducible research workshop UBC, Vancouver, 2006 Joseph A. Dellinger geojoe@freeusp.org
Where did Vplot come from? • SEP was one of the first users of Unix • Jon just loved to buy fancy new graphics devices • Gould (200 dpi printer) • Varian (300 dpi printer) • Several flavors of Tektronix • Gigi (oooh, 8 colors!) • Envision (even better, 8 _settable_ colors!) • RasterTek (the “Movie” machine: 256 settable colors! WOW!) • Each of these devices had its own proprietary protocol • People wanted to plot on all those different devices without having to rewrite their program for each one!
Where did Vplot come from? • Rob Clayton, circa 1979, came up with the idea of a “virtual device” • The “V” originally stood for vector because originally the language only supported lines, polygons, and text • Dave Hale (?) invented a vector font for it (Later we also added Hershey fonts, which look nicer...)
Where did Vplot come from? • The virtual device had its own proprietary binary encoding, just like all the other devices of the time did. • Commands were an ascii single character possibly followed by one or more short ints (not too dissimilar to “tektronix vector language”) or a null-terminated text string • “e” – “erase” • “m short short” – move to x, y • “d short short” – draw from current position to x, y • “c short” - change to new pen color (0-7) • “T short short text \0” – print vector text of given height and orientation
Where did Vplot come from? • The virtual device had a plottable area and resolution designed to be compatible with the various devices of the time • 600dpi (multiple of 200dpi and 300dpi) • 8 colors • 4 by 3 aspect-ratio screen • screen 10.24 inches tall • a “pen” filter was written for each device to translate vplot language into that device’s language • very quickly the different pen programs started diverging
... and Joe arrived • I was given the job of writing a new “pen” program for the envision (a fancy color text / graphics terminal) • ... and maintaining the existing diverging pen programs • ... and fixing all the bugs in them (YIKES!) • I ended up writing a whole new routine for reading vplot. That was the “device-independent” part. • It called a structure of function pointers. • That “dev” structure contained the only device-dependent code. • I ripped out the device-dependent subroutines and grafted them onto my new structure, unifying all the diverse codes. • New vplot commands such as “raster” could be supported and immediately work consistently on ALL devices (!!!)
The device structure The even better trick: generic high-level routines. These digested complex commands into simpler ones. For example: a polygon could be filled by drawing vectors back and forth inside it, like mowing the lawn. /* low level output - * called by the generic high level output routines */ int (*plot)(); int (*startpoly)(); int (*midpoly)(); int (*endpoly)(); If you didn’t care about supporting the device efficiently, all you really needed to support were these low-level routines plus the control ones, and the device could then do “everything”. Slowly, perhaps, but it worked. That’s how we could add “raster” capabilities to vplot and immediately have EVERY device suddenly able to do raster. struct device{ /* control routines */ int (*open)(); int (*reset)(); int (*message)(); int (*erase)(); int (*close)(); /* high level output */ int (*vector)(); int (*marker)(); int (*text)(); int (*area)(); int (*raster)(); int (*point)(); int (*attributes)(); /* input */ int (*getpoint)(); int (*interact)(); };
Supporting a new device • First, support the commands for “move”, “draw”, “erase”, “change drawing color” • Add in other routines as needed to improve plotting efficiency • One person could be writing and debugging one device-dependent routine while another person worked on another. The device-independent and device-dependent parts could be worked on simultaneously as well. • Vplot had an extensive test suite that deviously exercised every part of the language, so you could test whether new code was really working or not, and check that no unanticipated bugs had been introduced.
For example, this one tests whether polygon fill is working properly. Drawing a polygon that intersects a clipping window can be a little tricky. A majority of the intrinsic native “polygon” commands on devices we bought failed this test, so we ended up using the generic vplot routine much of the time. It often even turned out that filling a polygon by drawing a bunch of vectors was faster than using the device’s built-in polygon fill command, too.
This one tests whether the width of fat lines, height of characters, positions of characters, and dashed-line intervals are all true to scale.
Oh, but we’re so much more advanced today! • Really? I’m not so sure. Today our incompatible plotting devices are called: • X [8-bit, 16-bit, 24-bit, different screen resolutions and shapes...] • gif, tiff, jpeg, png, etc... • postscript, encapsulated postscript, postscript level 3, etc • fig, etc... • Maybe vplot still has a place...
Challenges • Even the concept of a “virtual device” is surprisingly slippery: • Fit to screen, or true scale? • Aspect ratio of screen? • Color, black and white, grey scale, or grey simulated by dithering? • Black background or white? If black is white, what happens to the other colors, then? Does raster invert too? • Should text scale anisotropically or not? • How to handle multi-frame plots? • How to shield the user from device inadequacies? (e.g., generic routines for missing capabilities, pixc + greyc, dithering in software, limited number of colors...) • We did the best we could...
Oops, hit a bug in the ppt postscript converter! This should be a uniform grey scale. It does a really sucky job on fattening vectors, too. Letting vplot rasterize the plot produced a more pleasing result.
“Lost” Lore • Test suite (I still have a copy...) • Documentation (of that, too) • Forgotten commands • Plotting tricks • Tricks with text • Tricks with vppen
Vplot documentation and tests Tests: TEST_align TEST_colors TEST_hatch TEST_raster TEST_alignh TEST_coltab TEST_limit TEST_size TEST_aspect_ratio TEST_Cyrillic TEST_orient TEST_text TEST_clipping TEST_erase TEST_pattern TEST_white TEST_colormask TEST_greycol TEST_rascolor Documentation man pages: libvplot.mn pspen.1 raspen.1 vplotraster.mn vppen.1 pen.mn pstexpen.1 vplot.mn vplottext.mn xtpen.1 Description of how to support a new device: vplothacker.txt Folks don’t expect codes to have test suites or documentation.... and so even if you do have it originally, it tends to first get forgotten, then lost. Madagascar/RSF is built around the premise that tests should exist.
Some plotting tricks Note, I plotted the dashed line twice! First thick and black, then thinner and red. The dashed line is from “Contour”, using the same plot position as the raster plot.
pldb < fig.v | sed –e ‘s/Cusp/Asparagus/’ | plas > fig2.vvplot2gif fig2.v fig2.gif yscale=.5 txscale=1.5 dashscale=3
Spike k1=5 n1=10 | Graph title=‘\s200 \F11 CHebyshchev\^\s100 2’ out=plot.vvplot2gif plot.v plot.gif fat=3 scale=1.5 yscale=.7 Vplot fonts support ligatures. Here note “CH” and “shch” are single characters.
pstexpen align.v align.eps fat=4 color=y yscale=.6 txscale=1.2
pstexpen align.v align.eps fat=4 color=y yscale=.6 txscale=1.2 \ txsquare=no Programs that include text in their graphics should justify their output text properly, so that labels grow and shrink the right way.
vppen: the pen filter for the virtual vplot device • There are quite a lot of parameters that can be used to transform a plot while plotting it • Once you like the result, plot it with “vppen” • It then writes back out a vplot file that will produce what you see without needing any transformation parameters
vppen align.v fat=4 yscale=.6 txscale=1.2 txsquare=no > alignv.vpstexpen alignv.v alignv.eps color=y
Other things vppen can do • Instead of plotting, it can tell you the size and position of a plot (this is how vplot2gif and pstexpen can work) vppen stat=y *.v demo_bering.v: h= 7.81 w= 12.07; x=( 0.42, 12.49) y=( 1.07, 8.88) demo_impulse.v: h= 5.85 w= 7.95; x=( 0.62, 8.56) y=( 0.77, 6.62) demo_jon.v: h= 6.39 w= 13.45; x=( 0.14, 13.60) y=( 0.74, 7.12) demo_reciprocity.v: h= 6.61 w= 6.20; x=( 0.70, 6.90) y=( 0.40, 7.01) All 4: h= 8.48 w= 13.46; x=( 0.14, 13.60) y=( 0.40, 8.88) Total 4 plot frames. It can also combine plots in various ways...
vppen demo*.v gridnum=2,2 grid=2 > junkpstexpen junk junk.eps color=y fat=2
vppen demo*.v gridnum=2,2 grid=2 rotate=-20 > junkpstexpen junk junk.eps color=y fat=2
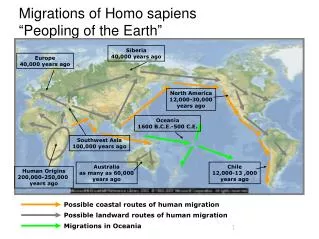
If you really go crazy then you can put some quite complicated stuff together with vplot. This figure predates the existence of matlab, mathematica, and postscript...
Where to from here? • Enhance programs like “Wiggle”, “Graph”, “Grey” to better use vplot? • Use some of the system’s features that were never really used, such as: • named groups • the “interact” option • user-defined fonts
Where to from here? • Keep the rendering software but switch to a more modern plot language? • Take the chance to abandon backwards compatibility and fix a few things? • Take the chance to make some improvements such as anti-aliasing raster, more colors at a time, etc? • How can “lore” be preserved?
Care to hear more about any of these technical points? • The concept of a “virtual device” is slippery: • Should text scale anisotropically or not? • Black background or white? If black is white, what happens to the other colors, then? Does raster invert too? What happens if you redefine color 0 (= the background color) halfway through?! • Color, black and white, grey scale, or grey simulated by dithering? • Fit to screen (size=r), or true scale (size=a)? • Aspect ratio of screen (stretchy or rigid)? • How to handle multi-frame plots? • How to shield the user from device inadequacies? (e.g., generic routines for missing capabilities, pixc + greyc, dithering issues, limited number of colors: vp_rascoltab...)
Thanks! • to Sergey for inviting me • to BP for letting me come • to all the people who helped create and support vplot, especially: Jon Claerbout, Glenn Kroger, Dave Nichols, and Steve Cole