Download

1 / 49
490 likes | 732 Views
DEVELOPED BY: UNIVERSITY OF TOLEDO http:// www.radon.utoledo.edu /. FUNDED BY: OHIO DEPARTMENT OF HEALTH. MANAGEMENT OF INDOOR RADON IN THE STATE OF OHIO. Ashok Kumar Charanya Varadarajan Suman Maroju Department of Civil Engineering University of Toledo. April 2007.

E N D
DEVELOPED BY: UNIVERSITY OF TOLEDO http://www.radon.utoledo.edu/ FUNDED BY: OHIO DEPARTMENT OF HEALTH MANAGEMENT OF INDOOR RADON IN THE STATE OF OHIO Ashok Kumar Charanya Varadarajan Suman Maroju Department of Civil Engineering University of Toledo April 2007
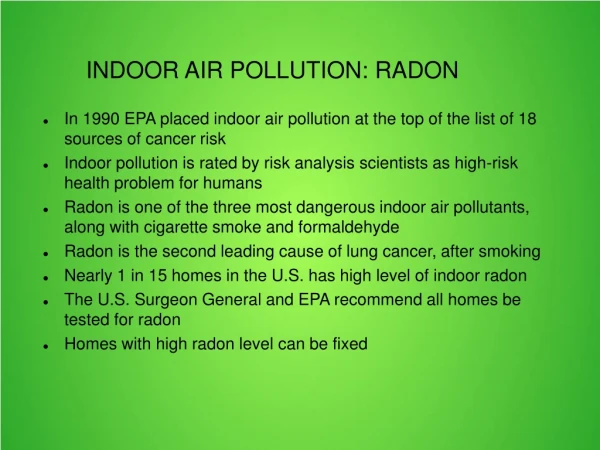
Different Sections of Ohio Information Web Site • Information on Radon • Health Risks • Preventive Measures • Radon Concentrations Across Ohio • Homes • Schools • Water • Mitigation • Testing Procedures • Geology of Radon • Other sources of Information • Lists of Radon Professionals • F.A.Q
HOME SCHOOL MITIGATION TESTER WATER OHIO RADON INFORMATION SYSTEM
OBJECTIVE • Store information on the home, school, water, and mitigation radon tests carried out in Ohio • Analyze the radon data to yield specific results for better management and mitigation of radon in Ohio homes and schools • Determine the removal efficiencies of the mitigation systems • Provide to the public a radon information system on the web
DATABASE • Licensed contractors perform the tests and submit the test details to the Ohio Department of Health (ODH) • Processed data stored in MS Access • Queries built in MS access are used for the analysis of the data • Reports of the analysis are submitted to the ODH every quarter
HOMES DATABASE • The most extensive database. • Built as SQL Server 7.0/MS Access database. • Data were obtained from government agencies, university researchers, and commercial testing companies. • The many data sets were combined to produce a unified database that includes 1500 zip code areas in Ohio. • Vast majority of the data (something over 95 percent) comes from houses where the tests were done by the homeowners using either charcoal canisters or alpha-track detectors. • About 93 percent of the data were sent on computer disks and so were transferred without transcription errors.
Statistics for the State of Ohio Unit- pCi/l Total Number of Records – 139,152
Results • Total number of counties in Ohio - 88 • Number of counties having GM indoor radon concentration more than 4.0 pCi/l is 23 (was 29 in 2006 – see Table 1) • Licking is the only county with GM of radon concentration greater than 8 pCi/l Table 1: Counties currently below 4pCi/l
Results Zip codes in the database – 1500 Incorrect zip codes – 243 Correct zip codes - 1257 Number of zip codes having geometric mean indoor radon concentration more than 4.0 pCi/l - 442
Individual County Maps Showing Variation among Zip Codes Unavailability of Complete zip code shapefile
SCHOOL DATABASE • SHORT-Term and LONG-Term test data • 865 Radon School Tests • Complete Information - 852 • Schools long term tested – 154
The ODH School Testing Program has covered 865 schools in 41 counties
Statistics for School Counties with GM of Radon Concentration >= 4 pCi/l
Total number of counties tested -42 Total number of schools tested (Short term) - 865 (852 complete) Total number of schools showing maximum radon concentration in any single room greater than 4 pCi/l - 259 Total number of rooms tested - 28649 Total number of rooms having radon concentration greater than or equal to action level of 4 pCi/l -1694 Summary of Results Approximately 30.5% of schools in Ohio have a potential for at least one room in excess of the USEPA action level (4 pCi/l) compared to 19.3% nationwide.
MITIGATION DATABASE 17, 089 records 15 different types of systems have been reported by the contractors
Number of Records with Pre-Mitigation Level between 4 pCi/l and 20 pCi/l for Years 2001 to 2006 Number of Records with % Removal Less Than 50 For Years 2001 to 2006
Average Removal Efficiency by Each Type of System (2001) Note: Blue identifies the best performing system; Grey identifies the second best performing system
Note: Blue identifies the best performing system; Grey identifies the second best performing system Average Removal Efficiency by Each Type of System (2002)
Average Removal Efficiency by Each Type of System (2003) Note: Blue identifies the best performing system; Grey identifies the second best performing system
Average Removal Efficiency by Each Type of System (2004) Note: Blue identifies the best performing system; Grey identifies the second best performing system
Average Removal Efficiency by Each Type of System (2005) Note: Blue identifies the best performing system; Grey identifies the second best performing system
Average Removal Efficiency by Each Type of System (2006) Among the 40 different combinations of mitigation systems, these are some of the best performing systems. The other systems and combinations have very few records to substantiate the high removal efficiency. Note: Blue identifies the best performing system; Grey identifies the second best performing system
Variation of Removal Efficiency with Pre- and Post Mitigation Level for Best Performing System for the Year 2003
Variation of Removal Efficiency with Pre- and Post-Mitigation Level for Best Performing System for the Year 2004
Variation of Removal Efficiency with Pre- and Post-Mitigation Level for Best Performing System for the Year 2005
Variation of Removal Efficiency with Pre- and Post-Mitigation Level for Best Performing System for the Year 2006
Summary • Most efficient system in Ohio for the year 2001 -2006 is Sub-slab Depressurization System • Efficiency is a function of pre-mitigation and post-mitigation levels • Efficiency of the mitigation systems decreases with decrease in pre-mitigation level as concentrations cannot be reduced below a certain level • Efficiency of the mitigation system decreases with increase in the post-mitigation level
TESTERS DATABASE Stores the information on the radon tests Hard copy of the test information submitted to ODH is computerized at the UT and is stored in a tabular form for easy access and analyses Data is queried in MS Access to arrive at key statistics for radon measurements in all zip code areas and counties Arithmetic mean, geometric mean, standard deviation, variance, maximum and minimum observed concentrations are calculated 44,864 records in the database
Statistics for Counties with GM of Radon Concentration >= 4 pCi/l
Zip codes with GM of radon concentration greater than 4 pCi/l Number of Zip codes greater than 4 pCi/l – 254 Number of Zip codes greater than 8 pCi/l – 60 Number of Counties greater than 4 pCi/l – 21 Number of Zip codes greater than 8 pCi/l – 2 Number of zip codes tested - 853 Number of counties tested - 84
WATER DATABASE • Water database consists of two sets of controls - public water wells and private water wells. • Ohio EPA provided the information on public water wells. • Information on private water wells were synthesized from M.S. theses completed at Ohio Universities.
Radon Concentration in Private Water Wells in Counties of Ohio
Results • 65 wells of the 1065 private water supply data have concentrations over 1000 pCi/l • 28 in Logan County and 13 in Delaware • 7 wells have concentration over 3000 pCi/l • No public water supply system has concentration greater than 1500 pCi/l
Conclusions • A successful integrated Ohio Radon Information System • The information helps is assessing the extent of radon problem • The best mitigation systems are determined • Website helps in creating awareness
Comments • Informed of error in the county listing of some public water wells in the dataset • Updated the website with the newest radon statistics • Developed and posted on the web individual county maps showing the variation of radon in each zip code
To evaluate the best Interpolation technique for the radon concentrations data • To evaluate the radon concentrations for unmeasured zip code locations in Ohio using the best Interpolation technique New Work- GIS Interpolation Techniques for Radon Data
Interpolation Techniques • Kriging • Inverse Distance Weighting • Radial Basis Function • Local Polynomial Interpolation • Global Polynomial Interpolation
Acknowledgements • Ohio Department of Health/ USEPA • Dr. Jim Harrell and Dr. Andrew Heydinger (University of Toledo) • Graduate students • Staff members of the ODH


![Projected Senior Populations in the State of Ohio [Infographic]](https://cdn4.slideserve.com/7255554/slide1-dt.jpg)