Download
1 / 1
10 likes | 237 Views
Sequence and comparative analysis of Leuconostoc dairy bacteriophages. Witold Kot 1 , Lars H. Hansen 2 , Horst Neve 3 , Karin Hammer 4 , Per D. Pedersen 5 , Søren J. Sørensen 2 , Knut J. Heller 3 and Finn K. Vogensen 1 .

E N D
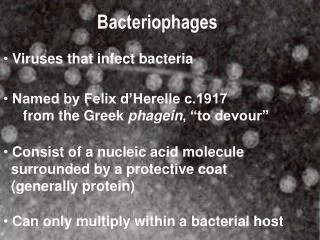
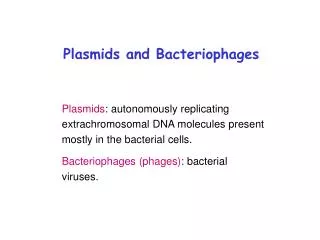
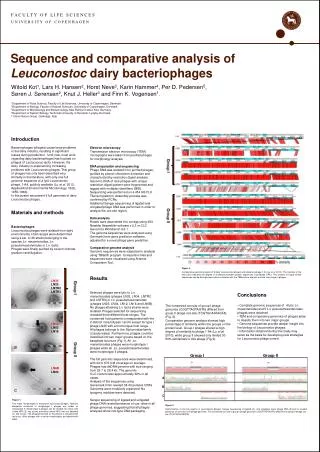
Sequence and comparative analysis of Leuconostoc dairy bacteriophages Witold Kot1, Lars H. Hansen2, Horst Neve3, Karin Hammer4, Per D. Pedersen5, Søren J. Sørensen2, Knut J. Heller3 and Finn K. Vogensen1. 1Department of Food Science, Faculty of Life Sciences, University of Copenhagen, Denmark. 2Department of Biology, Faculty of Natural Sciences, University of Copenhagen, Denmark. 3Department of Microbiology and Biotechnology, Max Rubner-Institut, Kiel, Germany. 4Department of System Biology, Technical University of Denmark, Lyngby, Denmark. 5Clerici-Sacco Group, Cadorago, Italy. Introduction Bacteriophages (phages) cause large problems in the dairy industry, resulting in significant losses during production. Until now, most work regarding dairy bacteriophages has focused on phages of Lactococcus lactis. However, the dairy industry is experiencing increasing problems with Leuconostoc phages. This group of phages has only been described very limitedly in the literature, with only one full genomic sequence of a lytic Leuconostoc phage, 1-A4, publicly available (Lu et al. 2010, Applied And Environmental Microbiology, 76(6), 1955-1966). In this poster we present 9 full genomes of dairy Leuconostoc phages. Materials and methods Bacteriophages Leuconostoc phages were isolated from dairy environments. Host ranges were determined using a set of 28 strains belonging to the species Ln. mesenteroides, Ln. pseudomesenteroides or Ln. lactis. Phages were finally purified by cesium chloride gradient centrifugation. Electron microscopy Transmission electron microscopy (TEM) micrographs were taken from purified phages for morphology analysis. DNA preparation and sequencing Phage DNA was isolated from purified phages, purified by phenol-chloroform extraction and characterized by restriction digest analysis. Genomic DNA of nine phages with unique restriction digest pattern were fragmented and tagged with multiplex identifiers (MID). Sequencing was performed on a 454 GS FLX Titanium platform. Assembly process was confirmed by PCRs. Additional Sanger sequencing of ligated and unligated phage DNA was performed in order to analyze the cos site region. Data analysis Reads were assembled into contigs using 454 Newbler Assembler software v.2.3 or CLC Genomics Workbench 4.6.1. The genome sequences were analyzed using Genmark.hmm gene prediction software, adjusted for a novel phage gene prediction. Comparative genome analysis Genomic sequences were subjected to analysis using TBlastX program. Comparison files and sequences were visualized using Artemis Comparison Tool. Results Selected phages were lytic to Ln. mesenteroides (phages LN25, LN34, LNTR2 and LNTR3) or Ln. pseudomesenteroides (phages LN03, LN04, LN12, LN18 and LN6B). No phages attacking Ln. lactis strains were isolated. Phages selected for sequencing revealed three different host-ranges. The conserved host patterns corresponded with the 2 distinct morphotypes I and II except for type I phage LN25 with a third unique host range. All phages belongs to the Siphoviridaefamily (Caudovirales). Furthermore, phages could be classified into two major groups based on the baseplate structure (Fig.1). All Ln. mesenteroides phages were morphotype I phages while all Ln. pseudomesenteroides were morphotype II phages. The full genomic sequences were determined, with 44 to 876-fold coverage on average. Phages had dsDNA genome with size ranging from 25.7 to 28.4 kb. The genomic G+C content was approximately 36% in all cases. Analysis of the sequences using Genemark.hmm reveled 38-43 putative ORFs. Genomes were modularly organized. No lysogeny modules were detected. Sanger sequencing of ligated and unligated phage DNA reveled presence of cos- sites in all phage genomes, suggesting that all phages analyzed show cos-type DNA packaging. Group I Group II Figure 3. Comparative genome analysis of 9 dairy Leuconostoc phages and reference phage 1-A4 (Lu et al. 2010). The intensity of the red colourindicates the degree of similarities between protein sequences in predicted ORFs. Two clusters of highly similar sequences can be distinguished, which correlates with the TEM picture analysis and the host range of phages. Group I Group II LN34 LN25 LNTR2 LNTR3 • Conclusions • Complete genomic sequences of 4 lytic Ln. mesenteroides and 5 Ln. pseudomesenteroides phages were obtained. • TEM and comparative genomics of phages allow to classify them into two major groups. • Genome sequences provide deeper insight into the biology of Leuconostoc phages. • Information obtained during this study may serve as the basis for developing new strategies for Leuconostoc phage control. A The conserved cos-site of group I phage genomes (CGGTTAGTAGTA) differed from group II phage cos-site (TCGTGCAATAGTA) (Fig. 2). Comparative genome analysis showed high percentage of similarity within the groups on the protein level. Group I phages shared a high degree of similarity to phage 1-A4 (Lu et al. 2010), while group II showed only limited 30-60% similarities to this phage (Fig.3). LN12 LN03 LN18 B Group I Group II LN6B LN04 A B C C Figure 1. Two major morphotypes of analyzed Leuconostoc phages. Globular baseplate structures of morphotype I phages are visible on micrograph A. Morphotype II phages can be divided into those with visible NPS (B, see arrow) and those where NPS was not detected (C, see arrow). The phage presented on the picture is indicated with red color. Other phages with a similar morphotypes are labeled with black. Figure 2. Determination of cos-site regions in Leuconostoc phages. Sanger sequencing of ligated (A) and unligated, linear phage DNA (B and C) reveled presence of cos-sites in all phage genomes. The conserved cos-site of group I phage genomes (CGGTTAGTAGTA) differed from group II phage cos-site (TCGTGCAATAGTA).