Download
1 / 13
140 likes | 169 Views
Analyzing energy consumption trade-offs in broadband networks for content distribution. Discusses optimization options between transport and storage methods. Examines impact on carbon footprint and corporate responsibility strategies.

E N D
Energy Trade-offs among Content Delivery Architectures. Anja Feldmann, Andreas Gladisch, Mario Kind, Christoph Lange, Georgios Smaragdakis, Fritz-Joachim Westphal, Deutsche Telekom AG, Laboratories.
The big picture. Source: Bill St. Arnaud - Technology and SME business opportunities in the green space through communications enabled applications (CEA)
Components of sustainability are part of company strategies. SMART2020 Report: Carbon footprint of ICT will double until 2020 Operators are adopting corporate responsibility principles • Luis Neves, Head of the Corporate Responsibility unit at Deutsche Telekom: • „We must meet the numerous demands made of CR in all respects, • with sustainable products, energy efficiency…” • “…we have set ourselves the goal of reducing our CO2 emissions by 20 percent by the year 2020.” Source: Smart2020 Report; Deutsche Telekom AG Corporate Responsibility Report 2009
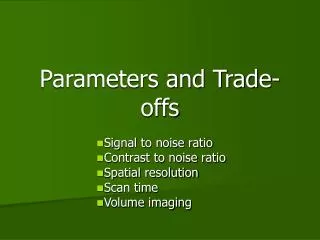
7 Energy consumption of broadband networks.Traffic volume and energy consumption. Growth of traffic volume… …and growth of energy consumption home networks 1.400% data centre & applications 1.200% mobile access & switching fixed networks 1.000% 800% 600% 400% 200% 0% 2009 2010 2011 2012 2013 2014 2015 2016 2017 2009 2011 2013 2015 2017 Based on: Cisco Visual Networking Index – Forecast and Methodology, 2007–2012. 2008 Based on: C. Lange, A. Gladisch - Energy Efficiency Aspects in Telecommunication Networks, OFC/NFOEC 2009.
HTTP based content is the dominating traffic contribution in broadband networks. Traffic characteristics of residential broadband networks • Request for delivery of content • 50% of HTTP traffic equal to 30% of overall traffic • P2P + UseNet equal to 20% • Distribution of popularity or access frequency shows a Zipf distribution (ά = 0.8) 11,5 % Image eDonkey 5,0 BitTorrent 8,5 32,8 % Video unclassified 10,6 57,6 RAR file 14,7 % 3,6 audio 2,2 % well-known 9,6 % text 10,0 other DPD 12,7 % unidentified 4,8 Downloads per time NNTP 11,7 % other HTTP Files sorted by Popularity G. Maier, A. Feldmann, V. Paxson, and M. Allman, “On dominant characteristics of residential broadband internet traffic,” in Proc. ACM Internet Measurement Conference, 2009.
Principle options for optimisation of content distribution architecture: trade off between transport and storage. • Central storage of content, for resilience reasons at least one backup data centre • Optimal delivery • Low demand for storage • High demand transport Centralised Data Centre • Exact duplication of content to a number of data centres • High demand for storage • Medium demand for transport Distributed Data Centre CDN • Managed distribution of content, mixture of two data centre types • Medium demand for storage • Medium demand for transport P2P • Different variants exists • Unmanaged • Structured managed • Unstructured managed • No demand for storage at operator • High demand for transport Each variant has some advantages for content delivery. Operators have to decide on their situation and strategy for the appropriate model. Customer Transport node Storage
Number of Data Centre • 1 + 1 • 10 • 1 + 1 • Up to 12 The principle content distribution architectures differ in few parameters only. Core Net- work Hops Access Network Set-Top Box DSLAM • Downstream • Storage • Downstream • 1 x • 12 Centralised Data Centre • Downstream • Storage • Downstream • 1 x • 3 Distributed Data Centre • Downstream • Storage • Downstream • 1 x • 12 / 3 CDN • Downstream • Upstream • Multistorage • Downstream • Upstream • 2 x • 3 P2P
0 Energy consumption per bit: DSL and centralised data centre server are major contributors in content delivery chain. ECb in цWs ECb = Energy Consumption per bit Storage Up Down Up Down Aggr. Switch BRAS Edge Router Core Router OTN / WDM Edge router LAN Switch Server Storage Set-Top Box DSLAM Notice: DSL is shown for 25/5 Mbit/s Down-/Upstream
Single file download energy consumption: Centralised or Distributed Data Centre are best for any access frequency. • P2P requires two times the energy (logarithmic scale!) • Depending on access frequency • Centralised Data Centre is optimal for less than one download per hour • Distributed Data Centre is optimal for more than one download per hour • CDN: “best of both worlds” and Conclusions P2P Centralised DC CDN Distributed DC
e Total energy consumption:Data centre options and CDN are very similar and more efficient as P2P. • Optimal strategy is mixture of storage and transport • CDN is the optimal distribution for total energy consumption • Distributed Data Centre (DC) is close to CDN • Centralised Data Centre is little less optimal than Distributed DC • P2P is at least more than two times • Increasing number of replicas require more energy • Overall delta depends not on popularity Conclusion in GWh 5.500 P2P Bubble 5.000 4.500 4.000 P2P DHT 3.500 P2P 3.000 2.500 2.000 Distributed DC 1.500 Centralised DC 1.000 CDN 500 Popularity parameter 0 0 0.2 0.4 0.6 0.8 1
B Impact analysis of set-top box energy consumption:P2P approach is good for operators, but not preferable in terms of sustainability. Normalised total energy consumption P2P -70% CDN -28% P2P without STB Popularity parameter 0 0.2 0.4 0.6 0.8 1
Operators have different options to optimise energy consumption of content delivery architectures. • Popularity of content (access frequency) has a large impact on energy consumption • Difference in total energy consumption for Data Centre solutions and CDN is rather small and depends not on popularity • P2P is only preferable, if energy consumption of set-top boxes is neglected • Analysis is done assuming xDSL access technology, influence of other access technologies is for further study Summary of analysis Conclusion • Strategy to optimize energy consumption for content delivery is influenced by contribution from storage and transport and depends on access frequency • CDN is the optimal case for sustainable operators