
Calcium Activation of Heart Mitochondrial Oxidative Phosphorylation: Role of the Fo/F1ATPase
Research study investigating the role of calcium in stimulating mitochondrial ATP production in cardiac tissue. Methods included isolation of mitochondria, measurement of ATP production, membrane potential, and NADH levels in response to calcium depletion. Results showed calcium-dependent activation of the mitochondrial Fo/F1ATPase. The study provides valuable insights into the regulatory mechanisms of ATP production in the heart.

Calcium Activation of Heart Mitochondrial Oxidative Phosphorylation: Role of the Fo/F1ATPase
E N D
Presentation Transcript
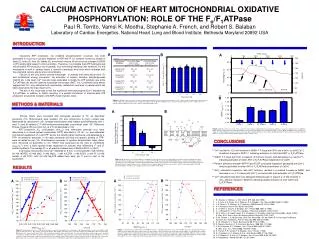
METHODS & MATERIALS INTRODUCTION CONCLUSIONS A Classically ATP production, via oxidative phosphorylation (ox-phos) has been postulated to occur by a cytosolic feedback of ADP and Pi (1); however numerous studies in heart (2), brain (3), liver (4), kidney (5), and smooth muscle (6) do not show changes in [ADP] or [Pi] lending little support to this contention. Therefore, it is probable that ATP hydrolysis and mitochondrial ATP production are in parallel, thus minimizing imbalance with workload. For this mechanism to work in cardiac tissue, a cytosolic transducer must exist which activates both the contractile activity and ox-phos concomitantly. Calcium is the only known second messenger to activate both mechanical work (7), and biochemical energy conversion, via activation of calcium sensitive dehydrogenases (CaDH) (8), in the heart. Ca2+ has also been postulated to modify the ATP synthetic rate at the Fo/F1ATPase (9) and the adenine nucleotide translocase (ANT; 10). Combined these effects suggest that Ca2+ may stimulate both intermediary metabolism and work in parallel which has been observed in the intact heart (2,11). The aim of this study was to test the hypothesis that physiological [Ca2+] activates the Fo/F1ATPase, in addition to CaDH, resulting in a parallel stimulation of mitochondrial ATP production at substrate oxidation and ADP phosphorylation steps. Porcine hearts were harvested and retrograde perfused (4 0C) as described previously (12). Mitochondria were isolated (12) and cytochrome A (Cyta) content was determined as described in (13). Isolated mitochondria were loaded stoichiometrically with 1 nmol 5 (and 6)-carboxy-2’-7’-dichlorofluoresceindiacitate succinimidyl ester (CF; Molecular Probes, Eugene OR) per nmol Cyta at 4 0C as described in (12). ATP production (O2 consumption (mVO2)) and membrane potential (Dy) were determined in a closed system respirometer (370C) described in (12,14). Dy was estimated from Nernst equilibrium of 4 mM TPP+ across the mitochondrial membrane, and detected by a TPP+ ion-selective electrode. In all cases electrode drift and non-specific binding of TPP+ were corrected as per (15). Simultaneous measures of pyridine dinucleotides redox status were monitored as described in (12). NADH was expressed as the ratio of coefficients (INADH.ICF-1) from a least squares linear regression for spectra, thus eliminating 10 and 20 scattering effects. The average R2 or all spectra collected were 0.99400.0001 (n=1340). In all cases mitochondria were Ca2+ depleted for 6 min. in running buffer (125 mM KCl, 20 mM HEPES, 15 mM NaCl, 5 mM MgCl2, 1 mM K2EDTA, 1 mM EGTA, 2 mM Pi, 0.1mM malate, 4 mM TPP+, with 3.4 mM Na2ATP added fresh daily, pH 7) prior to start of the experiment. B Figure 3.TypicalState 3activation plot of Fo/F1ATPase by Ca2+. (A) Data are plotted as mVO2 versus NADH. In all cases mitochondria were Ca2+ depleted, where 200mM ADP and 8.34mM atractyloside were added serially. Respiration was driven with a single addition of 2mM AsO4. Blue triangles represent fixed [Ca2+] with variable [SUC] (control), while Red triangles are mitochondria with variable [Ca2+] with fixed [SUC]. (B) Plot of State 3 and Dy with SUC. Symbols and conditions are as per Figure 3A. Solid lines are linear regressions through each condition, and had an average R2 of 0.941+ 0.007 (n=4; p<0.05). In all cases, AsO4 driven respiration was oligomycin-B sensitive indicating Fo/F1ATPase dependence (data not shown). RESULTS 535nM 535nM 535nM 535nM 535nM 0nM 0nM 0nM 0nM Figure 1.Representative force-flow relationships at State 3 respiration with variable Ca2+ and substrates. (A) Data are plotted as mVO2versus NADH for G/M (squares) and SUC (circles). Blue symbols represent fixed [Ca2+] with variable [substrate] (control), while Red symbols are variable [Ca2+] with fixed [substrate]. (B) Graph of mVO2 versus Dy with either G/M or SUC. Symbols and conditions are as stated in figure 1A.Solid and dashed lines are linear regressions. Substrate concentrations ranged from 5mM to 0.5mM for G/M and 15mM to 1.67mM with SUC, while Ca2+ used in these studies was fixed at 535nM free for control conditions. Under experimental conditions [Ca2+] ranged from 535 to 0nM free, while [substrate] was fixed at 5mM and 15mM for G/M and SUC, respectively. Dashed and solid lines are linear regressions, with an overall mean R2 of 0.900.04 (n=34), and were significantly different from zero (p0.05) in all cases. CALCIUM ACTIVATION OF HEART MITOCHONDRIAL OXIDATIVE PHOSPHORYLATION: ROLE OF THE Fo/F1ATPasePaul R. Territo, Vamsi K. Mootha, Stephanie A. French, and Robert S. BalabanLaboratory of Cardiac Energetics, National Heart Lung and Blood Institute, Bethesda Maryland 20892 USA A B Figure 2.(A)State 3 force flow slopes for mitochondria oxidizing G/M and SUC in the presence and absence of Ca2+. Buffers and Ca2+ depletion were as indicated in methods, while [substrate] and [Ca2+] were as indicated in Figure 1 legend. (B)Plot of ADP.O-1 ratios as a function of [Ca2+]. Data are means SEM, asterisks () indicate significant differences from State 3 (p0.05; dependent variable t-test). A B Figure 4.(A)State 3 time course plots of mVO2 and DY for mitochondria oxidizing G/M. Arrows indicate key additions of exogenous substrates, Ca2+, and ATPase. Buffers and Ca2+ depletion were as indicated in methods, while [substrate] and [Ca2+] were as indicated in Figure 1 legend. (B)Plot of NADH ratios as a function of metabolic condition. Optical spectra were obtained at steady state as indicated by blue arrows in Figure 4A. Data are means SEM, asterisks () indicate significant differences from preceding metabolic State (p0.05; dependent variable t-test). • Ca2+ resulted in >2.5 fold increase in NADH F-F slope with G/M, and a fall in Dy with [Ca2+], all without changes in ADP.O-1, indicating activation of CaDH and ANT or Fo/F1ATPase. • NADHF-F slope with SUC, increased 1.8 fold over control, with decreasing Dy over [Ca2+] indicating activation of either ANT or Fo/F1ATPase independent of CaDH. • Percent difference between ADP-Pi and FCCP-uncoupled respiration decreased with [Ca2+], verifying activation of either ANT or Fo/F1ATPase downstream of CaDH. • AsO4 stimulated respiration, with ANT inhibition, resulted in a marked increase in NADH, and decrease in Dy,F-F slopes with [Ca2+], consistent with pure activation of Fo/F1ATPase. • Ca2+ stimulated respiration has adequate metabolic gain to support a >3 fold increase in mVO2 without changes in [NADH], indicating parallel activation at both CaDH and Fo/F1ATPase. Figure 3.(A) Comparison of uncoupled and Ca2+ stimulated coupled respiration. Plot of percentage difference between State 3 and FCCP-uncoupled respiration with increasing [Ca2+]. State 3 respiration, oxidizing SUC (15mM), was initiated with ADP (500mM) after Ca2+ depletion. Maximally uncoupled respiration was achieved by titration of [FCCP] (33.3nM final). Buffers and Ca2+ depletion were as indicated in methods, while [substrate] and [Ca2+] were as indicated in Figure 1 legend. Data are means SEM, asterisks () indicate significant differences from State 3 (p0.05; dependent variable t-test). (B) Schematic diagram of metabolic uncoupling and isolation of Fo/F1ATPase with AsO4 REFERENCES 1. B. Chance, G. Williams, J. Biol. Chem.217, 383-393 (1955). 2. L. A. Katz, J. A. Swain, M. A. Portman, R. S. Balaban, Am J Physiol256, H265-74 (1989). 3. J. A. Detre, D. S. Williams, A. P. Koretsky, NMR Biomed3, 272-8 (1990). 4. A. P. Koretsky, Physiol Rev75, 667-88 (1995). 5. S. D. Wolff, C. Eng, R. S. Balaban, Am J Physiol255, F581-9 (1988). 6. C. J. Wingard, R. J. Paul, R. A. Murphy, J Physiol (Lond)501, 213-23 (1997). 7. W. G. Wier, J. R. Lopez-Lopez, P. S. Shacklock, C. W. Balke, Ciba Found Symp188, 146-60 (1995); E. Rios, M. D. Stern, Annu Rev Biophys Biomol Struct26, 47-82 (1997). 8. R. M. Denton, J. G. McCormack, Annu Rev Physiol52, 451-66 (1990); R. G. Hansford, R. Moreno- Sanchez, B. Lewartowski, Ann N Y Acad Sci573, 240-53 (1989). 9. E. W. Yamada, N. J. Huzel, Biochemistry28, 9714-8 (1989). 10. R. Moreno-Sanchez, R. G. Hansford, Biochem J256, 403-12 (1988). 11. F. W. Heineman, R. S. Balaban, Am J Physiol264, H433-40 (1993); B. Wan, et al., Am J Physiol265, H453-60 (1993). 12. S. French, P. R. Territo, R. S. Balaban, Am J Physiol (1998). 13. R. S. Balaban, V. K. Mootha, A. Arai, Anal Biochem237, 274-8 (1996). 14. V. K. Mootha, A. E. Arai, R. S. Balaban, Am J Physiol272, H769-75 (1997). 15. H. Rottenberg, J Membr Biol81, 127-38 (1984).


