NSSE 2008
NSSE 2008. NSSE 2008. When? Spring, 2008 Who? Freshmen and Seniors random sample How? Electronic and Snail mail follow up Respondents? 30% response rate 26 % freshmen and 35% seniors Mostly full time, half transfers. NSSE 2008. Background:


NSSE 2008
E N D
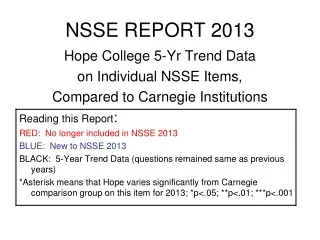
Presentation Transcript
NSSE 2008 When? Spring, 2008 Who? Freshmen and Seniors random sample How? Electronic and Snail mail follow up Respondents? 30% response rate 26% freshmen and 35% seniors Mostly full time, half transfers
NSSE 2008 Background: Engagement is time and energy devoted to educationally purposeful activities BEST SINGLE PREDICTOR OF LEARNING AND PERSONAL DEVELOPMENT
Seven Principles of Good Practice in Undergraduate Education • Student-faculty contact (SFI) • Cooperation among students (SCE) • Active Learning (ACL) • Prompt feedback • Time on task • High expectations (LAC) • Respect for diverse talents and ways of learning (EEE)
Validity of Self-reported Data • People generally respond accurately about past behavior unless questions are sensitive or make them uncomfortable • If information is known to respondents • If questions are phrased clearly • If questions refer to recent activities • If respondents take questions seriously • If questions do not threaten, embarrass or violate respondents’ privacy • “Halo effect” – Inflating performance, grades or personal gains and efforts
Respondents Characteristics • Buffalo State College: 30% response rate26% freshmen,35% seniors • Peers: 29% response rate27% freshmen,30% seniors • Sampling error: ±2.8%
NSSE 2008 Means-weighted arithmetic average of responses on items • Gender • Enrollment status • Size
NSSE 2008 Effect size: “practical significance” of mean differences: .2 small .5 moderate .8 large
NSSE 2008 Peers Comparison Group: • Bridgewater State • Salem State • Slippery Rock U of Pa • U Mass-Boston • U Nebraska – Omaha • West Chester U of Pa • William Paterson of NJ
LAC (Level of Academic Challenge) Challenging intellectual and creative work is central to student learning and collegiate quality. Colleges and universities promote high levels of student achievement by emphasizing the importance of academic effort and setting high expectations for student performance. FrSr • Preparing for class 3.533.87 • # assigned books 3.243.09 • # papers 20 pages or more 1.361.57 • # papers 5-19 pages 2.382.45 • # papers fewer than 5 pages 3.082.91 • Emphasize analysis 3.053.04 • Emphasize synthesizing 2.852.95 • Emphasize making judgments 2.932.89 • Emphasize applying theories/concepts 2.993.10 • Working harder than you thought 2.702.84 • Campus environment emphasizes studying/academics 2.992.98
ACL (Active and Collaborative Learning) Students learn more when they are intensely involved in their education and asked to think about what they are learning in different settings. Collaborating with others in solving problems or mastering difficult material prepares students for the messy, unscripted problems they will encounter daily during and after college. Fr Sr • Asked questions in class 2.75 3.06 • Made a class presentation 2.292.84 • Worked with students during class 2.43 2.60 • Worked with classmates outside of class 2.292.49 • Tutored others 1.551.78 • Community based project in regular course 1.52 1.89 • Discussed ideas from class with others 2.63 2.70
SFI (Student –Faculty Interaction) Students learn firsthand how experts think about and solve practical problems by interacting with faculty members inside and outside the classroom. As a result, their teachers become role models, mentors and guides for continuous, life-long learning. Fr Sr • Discussed grades/assignments with instructor 2.692.87 • Talked about career plans with faculty/advisor 2.292.46 • Discussed ideas with faculty member 1.992.11 • Worked with faculty other than coursework 1.741.76 • Received prompt feedback from faculty 2.732.78 • Research project with faculty 0.070.15
EEE (Enriching Education Environment) Complementary learning opportunities enhance academic programs. Diversity experiences teach students valuable things about themselves and others. Technology facilitates collaborations between peers and instructors. Internships, community service and senior capstone courses provide opp9ortunities to integrate and apply knowledge. FrSr • Co-curricular activities 2.251.84 • Practicum, internship, filed experience 0.10 0.54 • Community service/volunteer work 0.36 0.55 • Foreign language coursework 0.24 0.42 • Study abroad 0.020.06 • Independent study/self-designed major 0.04 0.16 • Culminating senior experience 0.02 0.25 • Serious conversations with students (beliefs different) 2.762.59 • Serious conversations with different ethnicity 2.662.62 • Using electronic medium for assignment 2.552.66 • Environment encourages contact 2.73 2.40 • Learning community 0.130.25
SCE (Supportive Campus Environment) Students perform better and are more satisfied at colleges that are committed to their success and cultivate positive working and social relations among different groups on campus. Fr Sr • Environment provides support to succeed 2.982.77 • Environment helps with non-academic responsibilities 2.351.90 • Environment provides support to thrive socially 2.492.11 • Quality of relationships with other students 5.045.28* • Quality of relationships with faculty 4.895.18** • Quality of relationships with admin and offices 4.274.28*** *1=unfriendly, unsupportive, alienated to 7=friendly, supportive, sense of belonging **1=unavailable, unhelpful, unsympathetic to 7=available, helpful, sympathetic ***1=unhelpful, inconsiderate, rigid to 7=helpful, considerate, flexible
Highest Performing Areas First Year Buffalo State Peers Did a community-based project as part of a regular course 16% 9% Spent more than 5 hrs/week in co-curricular activities 21% 14% Institution substantially encourages contacts among diverse peers 56% 46% Institution substantially helps students cope w/non-academic matters 32% 26% Institution provides substantial support for social needs 40% 34%
Highest Performing Areas Senior Buffalo State Peers Worked harder than expectedto meet instructor’s expectations 66% 57% Talked about career plans withfaculty member or advisor 49% 36% Did practicum, internship, field experience 64% 45% Participated in communityservice or volunteer work 61% 48% Completed foreign language coursework 45% 33%
Lowest Performing Areas First Year Buffalo State Peers Read more than 10 assignedbooks or book length readings 23% 29% Institution emphasizes studying and academic work 67% 73% Asked questions/contributed to class discussions 48% 59% Made a class presentation 24% 33% Worked with other students on projects during class 37% 46%
Lowest Performing Areas Senior Buffalo State Peers Courses emphasized analyzingideas, experiences or theories 78% 82% Read more than 10 assigned books or book length readings 25% 30% Worked with classmates outside of class to prepare assignments 46% 51% Used an electronic medium to discuss or complete an assignment 55% 60% Positively rated their relationshipswith admin personnel and offices 41% 48%
Satisfaction How would you evaluate your entire educational experience at Buffalo State? 4 = Excellent, 1 = Poor
Satisfaction If you could start again, would you go to the same institution you are now attending? 4 = Excellent, 1 = Poor
THE CHALLENGE: To rank in the top 50% of engaged schools in all benchmarks of engagement.